Kuroto Fund, L.P. - Q1 2024 Letter
Dear Partners and Friends,
PERFORMANCE
Kuroto Fund, L.P. rose 7.3% in the first quarter while the Emerging Markets index gained 2.4% in the quarter.
The Kuroto Fund’s positive quarterly performance was primarily driven by our investments in Georgia and our banks in Nigeria and Kenya. A breakdown of Kuroto Fund's exposures and contribution can be found here.
KUroto's Historically Low Valuation
The Kuroto Fund currently trades at 5.1x this year’s earnings. Our portfolio of companies is growing earnings by 22% this year and generating a 7% dividend yield this year. It is important to note that the above weighted average figures represent an average of a diverse set of businesses and that a P/E ratio is not the most appropriate valuation ratio for some of the sectors in which we are invested. The preceding calculations also exclude two positions, each ~5% of the fund, that are holding companies and do not generate earnings today. That said, if you compare the current valuations of our companies to their historical averages, they are generally trading towards the low end of the historical ranges. While not perfect, we think the portfolio P/E ratio is an accurate way to represent the very attractive valuation of the fund today.
Only during the emerging market crisis of the late 1990s did Kuroto trade cheaper than it does today. We believe our portfolio’s surprisingly low valuation can be principally attributed to our concentration in smaller countries and markets that are excluded from or underrepresented in the emerging and frontier indices and therefore do not attract passive funds. It is also worth noting that several of the African markets in which we are currently invested have faced a challenging macro-economic environment following the COVID crisis.
Chart: Historical Portfolio Look-Through P/E Ratio
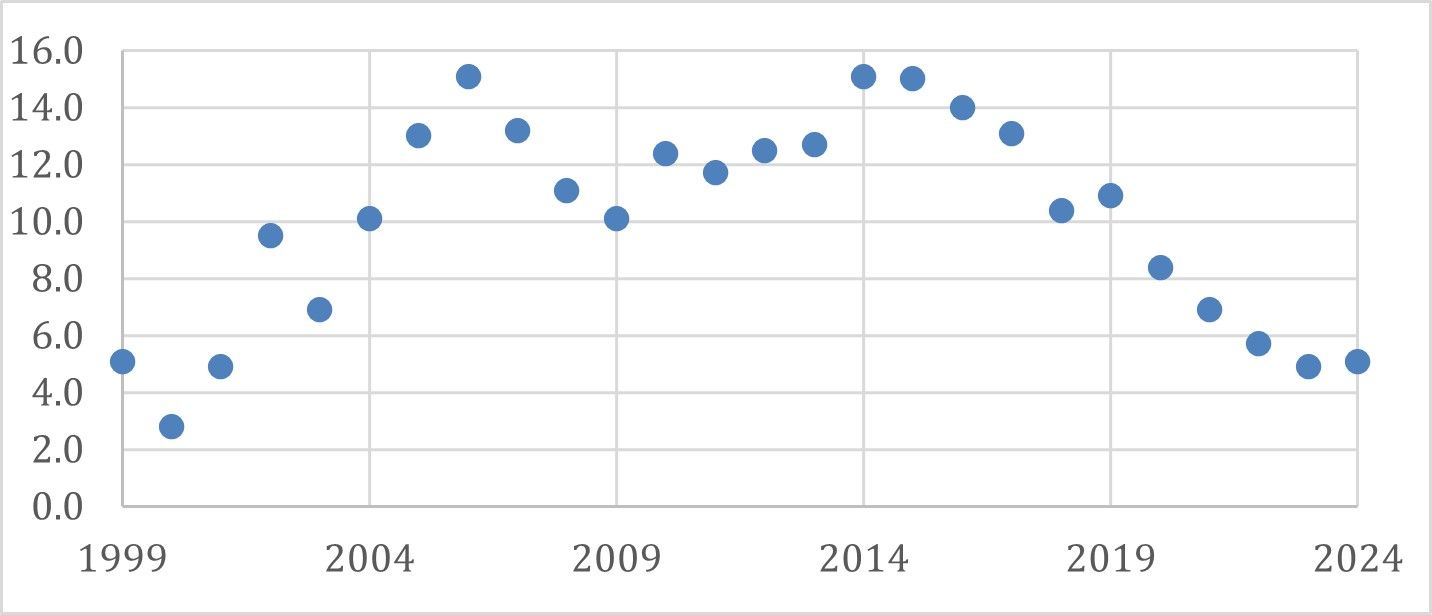
Source: Internal Equinox Analyst Estimates
Changes in KUroto's Sector Exposures
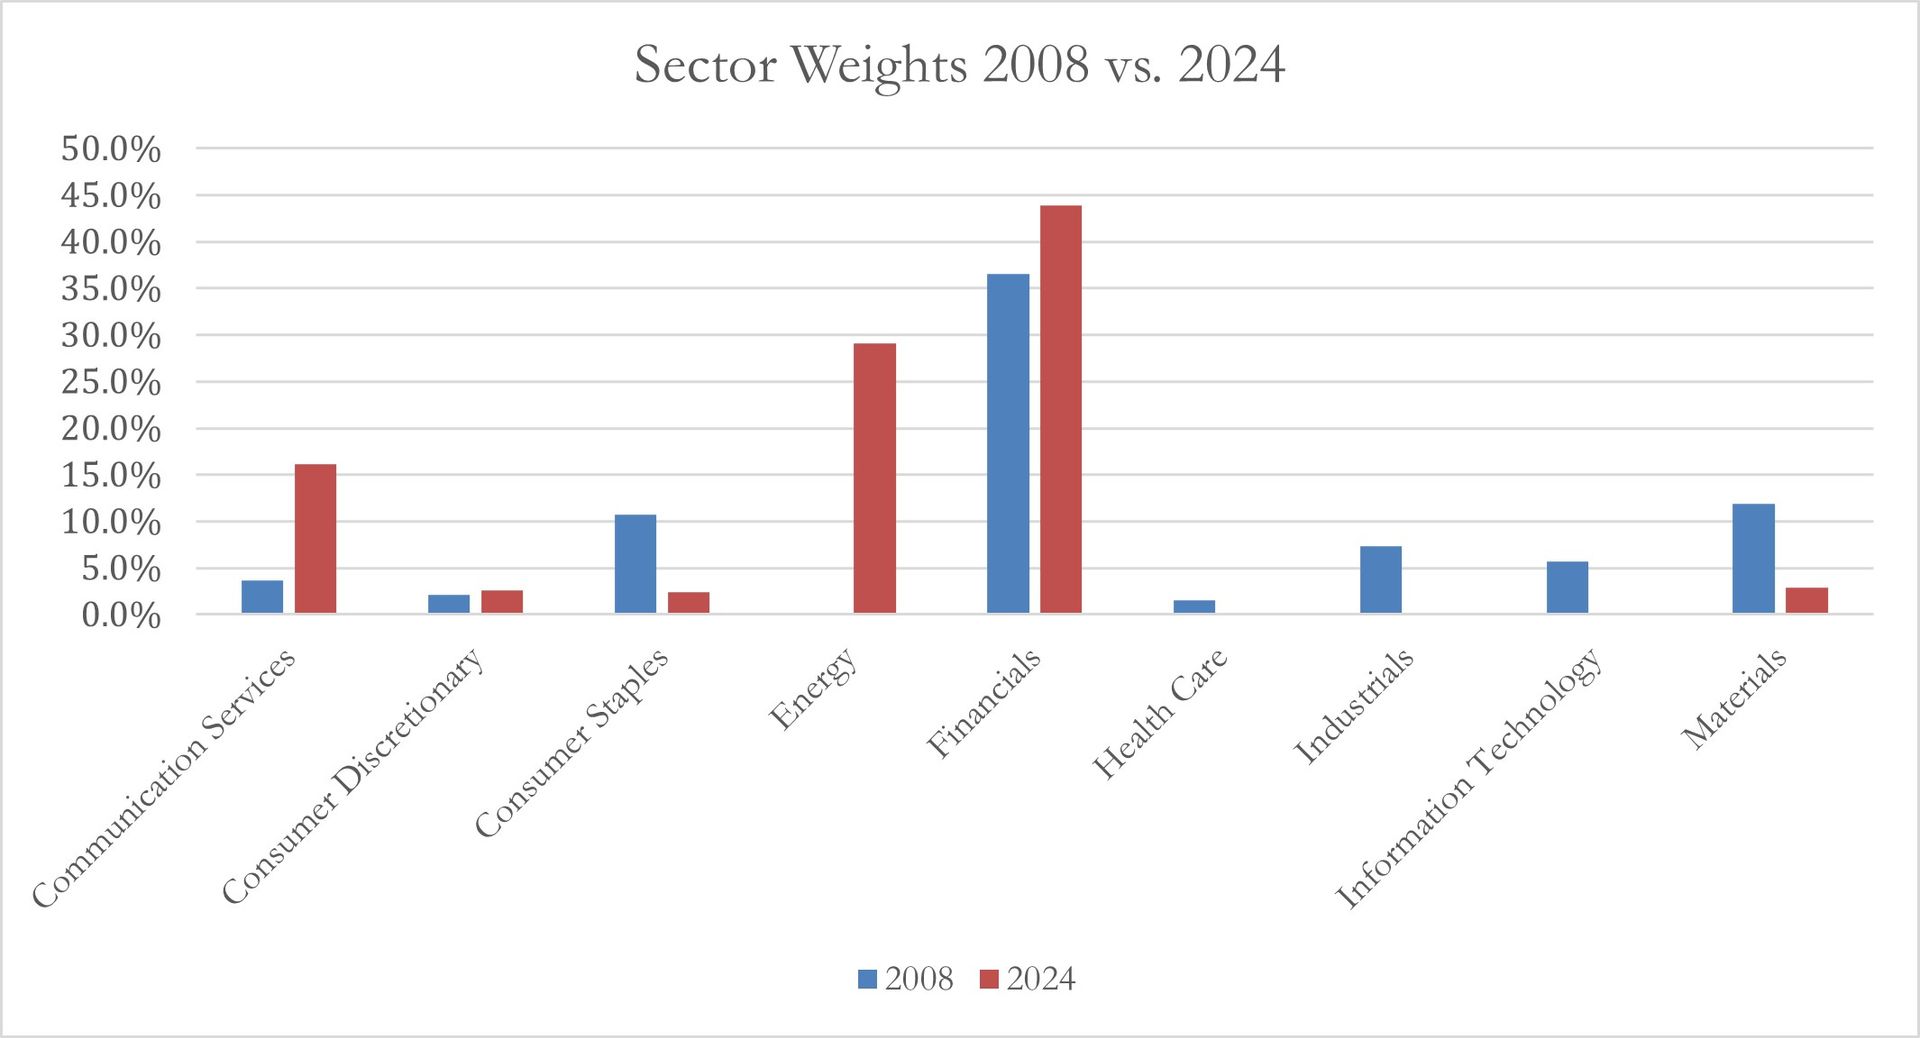
Over Kuroto’s twenty-five-year history, on average we have held approximately 30% of our portfolio in financials. Today, our portfolio weighting in financials is 44%. Our financials trade at 4x this year’s earnings and offer a 6% div yield. Over the past two decades as public companies, our financials have traded closer to 1.3x book value, 6.4x earnings, and generated a 2% dividend yield. In almost every case, the banks we own are the leading financial institution in a concentrated market. As a result, many of our banks are price setters and can generate high returns while assuming only modest amounts of credit risk.
We ramped up our energy company investments following the 2020 crash in oil prices. Our energy companies trade at a 22% free cash flow yield this year, and an estimated 27% free cash flow yield in 2025[1]. For energy companies, we believe the free cash flow yield is a better approximation of valuation than the P/E ratio given that actual depreciation in energy companies does not always match accounting depreciation.[2] While there are some important accounting nuances here, it’s noteworthy that the free cash flow yield of our energy companies is roughly equivalent to the earnings yield of our operating companies.
Half of the remaining 27% of Kuroto is invested in MTN Ghana. MTN Ghana is the dominant mobile carrier and mobile money operator in Ghana. MTN Ghana trades at 4x earnings and offers a 15% dividend yield. The low valuation of MTN Ghana is best explained by Ghana’s poor macroeconomic environment and compares favorably to MTN Ghana’s historical average P/E multiple of 7x earnings since its 2018 IPO.
Finally, it’s worth nothing that despite the change in business mix, our portfolio level ROE is not meaningful different than in times past, largely due to the high expected profitability of our energy companies comparing favorably to that of our consumer-focused investments of years past.
[1] Excluding one holding company from energy company portfolio metrics
[2] Our free cash flow yield metric includes maintenance and growth cap ex, and excludes capital spent to acquire incremental acreage.
Changes in KUroto's Geographic Exposures
In addition to the evolution of our sector exposures, our geographic exposure mix has changed significantly over time. For the first fifteen years, Kuroto Fund only invested in Asia. We broadened the fund’s mandate in 2014 to global emerging and frontier markets and, over time, have largely divested from Asia.
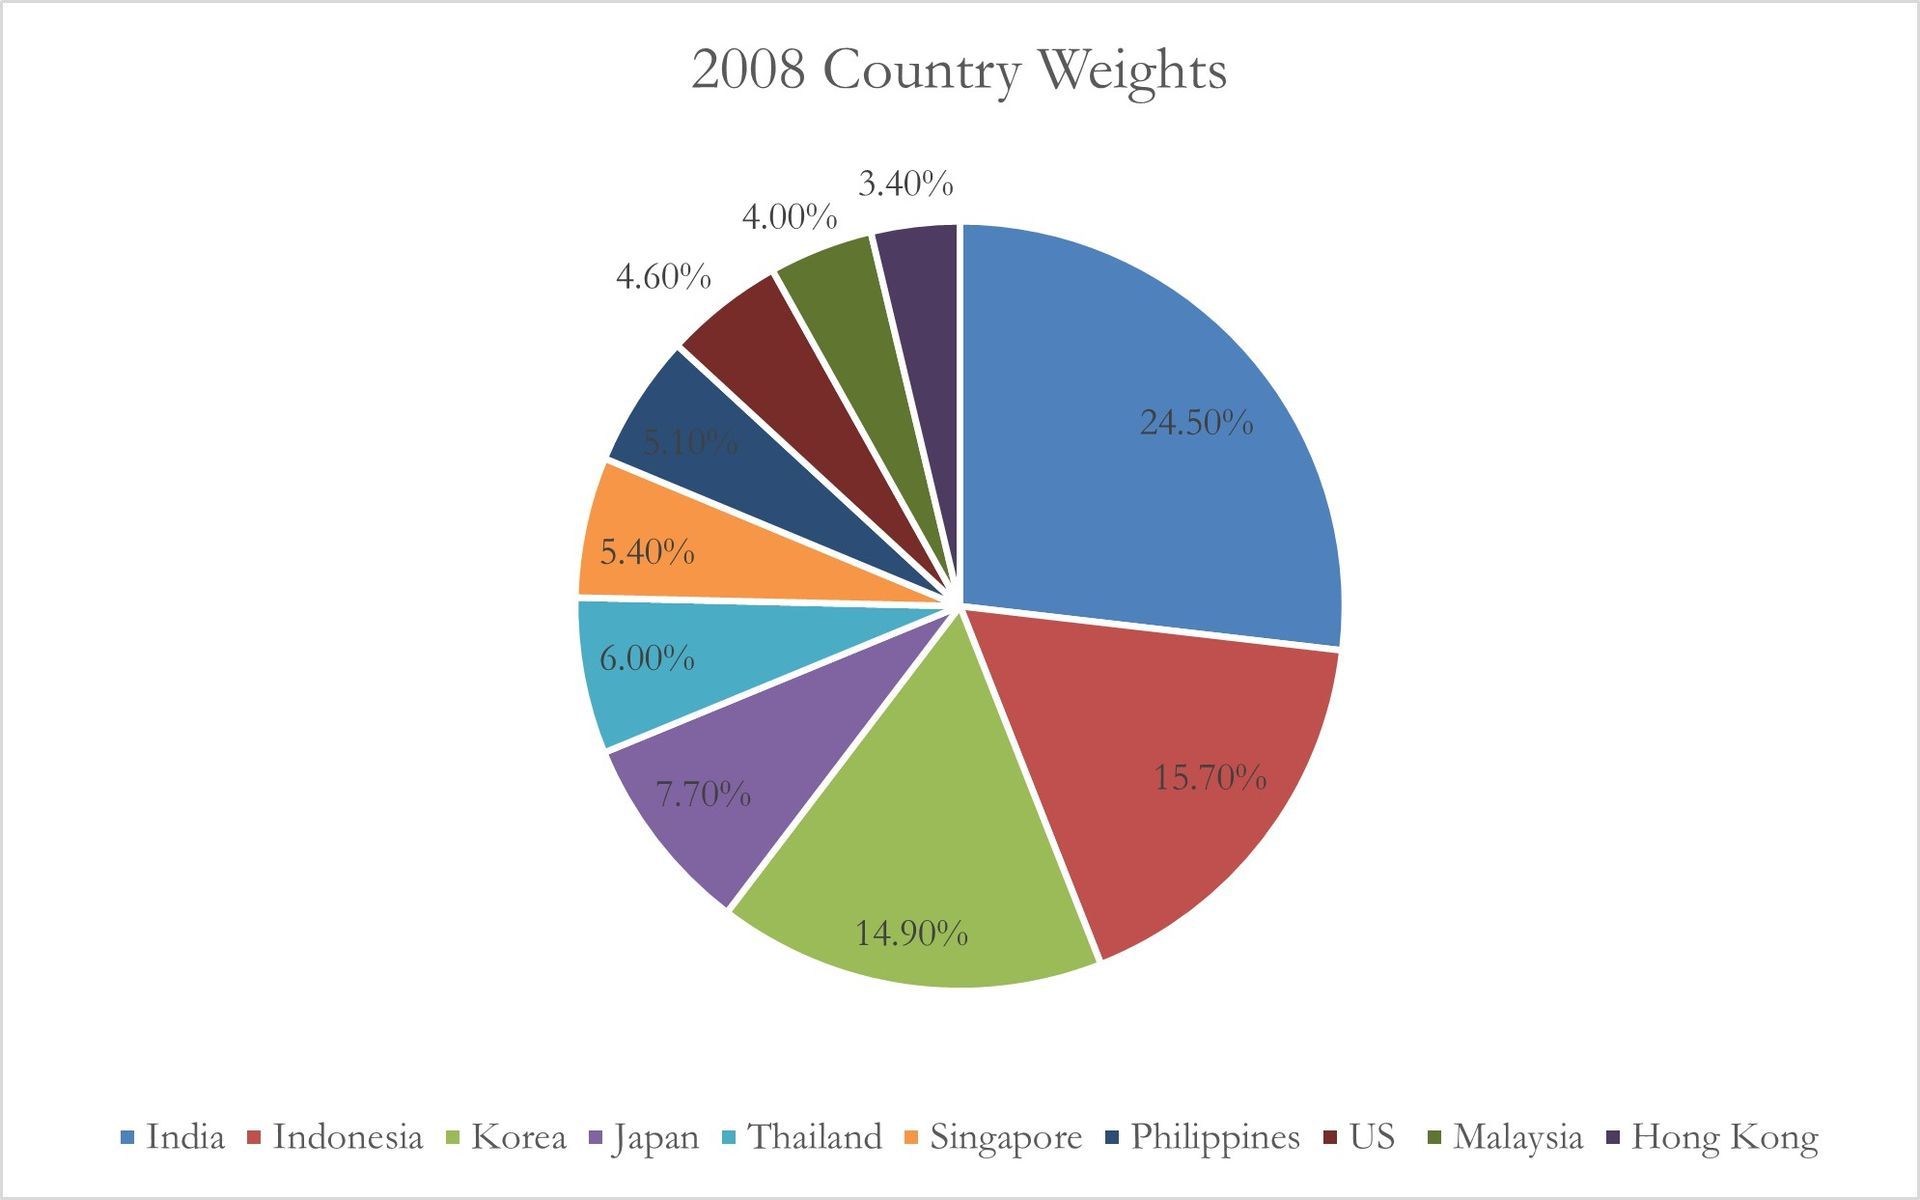
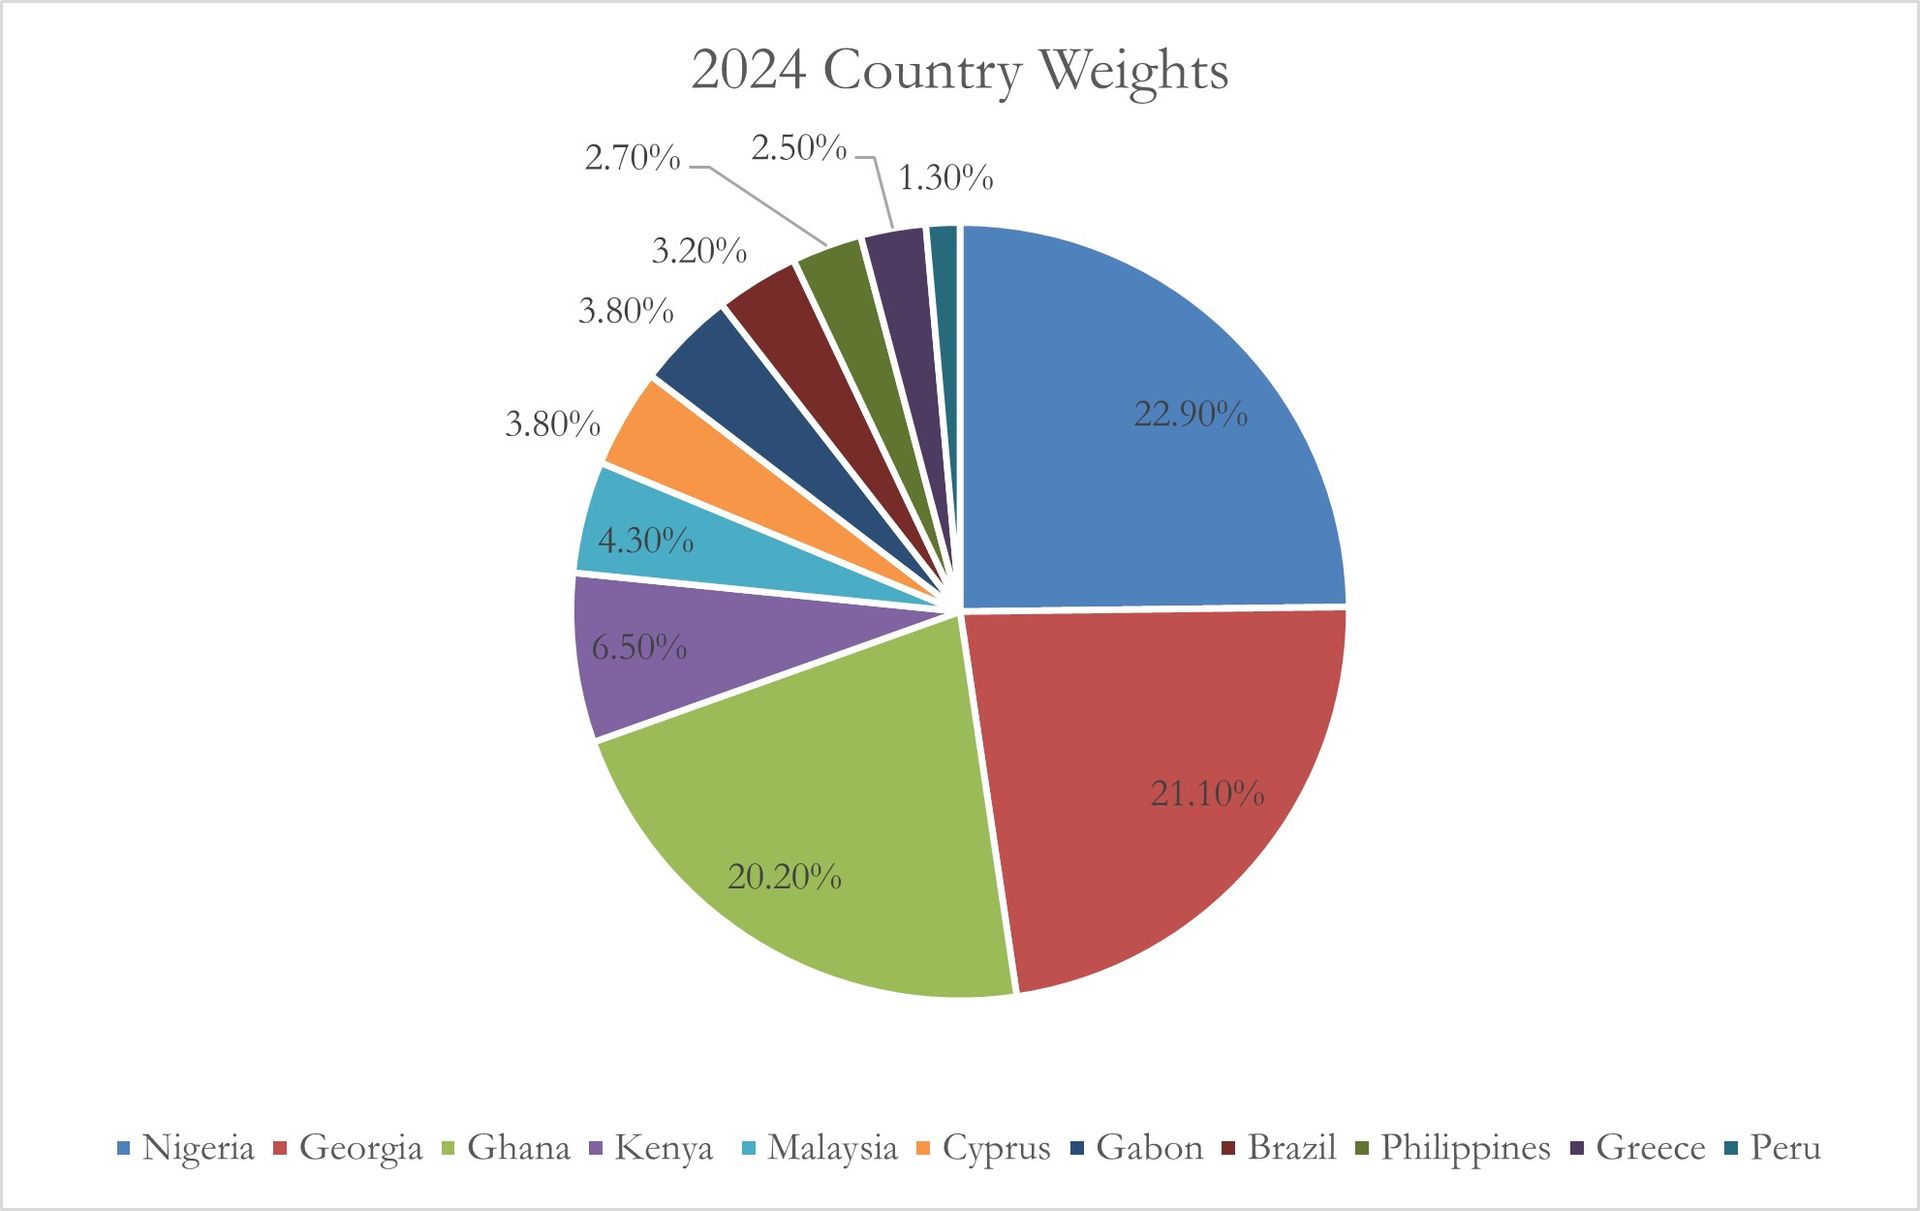
Since 2014, the macroeconomic performance of the countries in which we’ve invested have been a mixed bag. Economies like Georgia, Greece, and Cyprus have benefited from sensible economic policies, inflows from tourists and refugees, and EU funding. Our holdings in these markets, which currently constitute 30% of our portfolio, are up several times from their lows and are still trading in the range of 4-5x earnings.
The macroeconomic conditions for our non-energy Africa portfolio companies are a different story. The macroeconomic conditions in Nigeria, Ghana, and Kenya have been abysmal for several years. These countries which were struggling pre-COIVD, emerged from the COVID crisis with unsustainable levels of public debt after real growth rates slowed and government spending spiked upwards during the crisis. These countries have only recently begun the politically painful process of cutting spending to a sustainable level. As a result, these markets' valuations are at the low end of their historical ranges. Our non-energy businesses in these countries trade at 5x earnings and a 9% dividend yield this year.
CONCLUSION
In the past, low valuations have been a prelude to outperformance. Despite all the caveats that we detail in this letter, we believe that depressed valuations of our holdings will be resolved through meaningful outperforming going forward.
Sincerely,
Sean Fieler Brad Virbitsky
[1] Please note that estimated performance has yet to be audited and is subject to revision. Performance figures constitute confidential information and must not be disclosed to third parties. An investor’s performance may differ based on timing of contributions, withdrawals and participation in new issues.
Unless otherwise noted, all company-specific data derived from internal analysis, company presentations, Bloomberg, FactSet or independent sources. Values as of 3.31.24, unless otherwise noted.
This document is not an offer to sell or the solicitation of an offer to buy interests in any product and is being provided for informational purposes only and should not be relied upon as legal, tax or investment advice. An offering of interests will be made only by means of a confidential private offering memorandum and only to qualified investors in jurisdictions where permitted by law.
An investment is speculative and involves a high degree of risk. There is no secondary market for the investor’s interests and none is expected to develop and there may be restrictions on transferring interests. The Investment Advisor has total trading authority. Performance results are net of fees and expenses and reflect the reinvestment of dividends, interest and other earnings.
Prior performance is not necessarily indicative of future results. Any investment in a fund involves the risk of loss. Performance can be volatile and an investor could lose all or a substantial portion of his or her investment.
The information presented herein is current only as of the particular dates specified for such information, and is subject to change in future periods without notice.


