Kuroto Fund, L.P. - Q1 2015 Letter

Dear Partners and Friends,

PERFORMANCE & PORTFOLIO

Kuroto increased +7.3% in the first quarter and was up +7.6% through April 30. This compares to a +2.2% gain for the MSCI Emerging Markets Index through the first quarter and a +10.1% gain through April 30.[1]

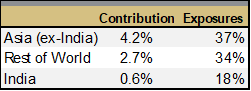
A large portion of the gains in the quarter resulted from one of our top-five holdings, Concepcion Industrial Corp., which increased by 48% during the quarter. Another significant contribution came from a rebound in the share prices of the event marketing company and the temporary power business which caused much of Q4’s negative performance and were discussed in that quarter’s investor letter. The fund’s investments in India were slight performance contributors while those in Latin America were moderate detractors.


In the quarter, Kuroto continued to hedge certain currencies for which we didn’t have a strong view as long as the cost wasn’t prohibitive. We now have hedged over 20% of the fund’s currency exposure. The fund exited its investment in Orica in Australia because Ian Smith, the CEO who was hired to improve the business, decided to leave the company. We also continued to trim some of our appreciated securities in India while adding to several of our existing investments in Malaysia, Vietnam and Indonesia. Lastly, we initiated a new Brazilian position during the quarter.

kuroto v. emerging markets


“By definition, you can’t outperform the market if you buy the market”

- Sir John Templeton

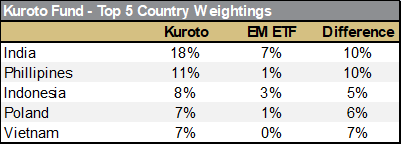
Our partners should not be surprised that the MSCI Emerging Markets Index has no influence on our investment decisions. However, we are aware that the benchmark can be a convenient means of evaluating Kuroto’s performance. As such, we thought that it would be a useful exercise to compare the weightings of the MSCI Emerging Markets Index to those of Kuroto[2]. Not unsurprisingly, the EM index and Kuroto are markedly different portfolios for a variety of reasons which we’ll discuss below. We believe that these differences result in a Kuroto portfolio which is superior due to its emphasis on quality, relative concentration, and a broader focus.

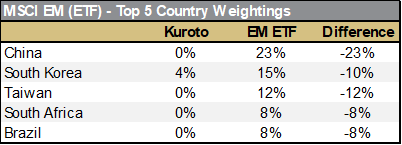
To begin with, the country exposures of the two funds are exceedingly different (see table below)[3]. The EM index is largely comprised of export-oriented North Asian countries, while Kuroto’s investments reside in countries whose economies are more driven by domestic consumption. Therefore, many of the index’ holdings are more dependent on growth or demand from the developed world than from the developing world. With that being said, we do look for domestically-oriented investments in all of these markets. However, we tend to encounter additional quality issues in North Asia. In China, corporate governance and management quality often prove to be an issue for us. How the business, management, owners, and capital came together is often difficult to discern, leaving us to wonder to what end and to whose benefit the company is being managed. The domestically-oriented businesses in South Korea and Taiwan often have difficulty generating enough growth to produce an attractive return for us. Additionally, capital allocation is so notoriously bad in Korea that last year the government decided to tax net income if companies didn’t spend enough of their profits on investments, salaries, and dividends.[4] 

In addition to having different country exposures, there is a stark difference in the level of concentration between the Kuroto portfolio and the EM index. As of March 31, Kuroto owned shares in 30 businesses, whereas the MSCI EM index comprised over 800 securities. As part of our investment philosophy, we consider ourselves to be business owners and believe that a proper owner mentality is only possible with a low-turnover, concentrated portfolio. The ownership approach allows us to have a long time horizon in order to maximize our returns. We also believe that very few high-quality investments generally exist at any one time. Therefore, we concentrate our capital in those special few.


The above differences exist in part because the EM index, as stated in its marketing documents, “aims to provide exhaustive coverage of the relevant investment opportunity set” and even boasts that it “covers approximately 85% of the free float-adjusted market capitalization.” To paraphrase, the index is targeting companies that are large in market capitalization and liquid in terms of daily trading values. The index does not focus on business quality or valuation. It does not take into account where a company does business; it only reflects where a company is listed.[5]


Kuroto is also using a broader definition of what an emerging market is than the MSCI. The MSCI has a market classification framework that focuses on a country’s economic development, size, liquidity, and market accessibility. If a market is not large enough in terms of liquidity or has ownership restrictions, then MSCI classifies it as a frontier market. Kuroto is happy to ignore the distinctions between emerging and frontier, instead we focus on whether country dynamics are benign enough not to overwhelm our investments. We will also capitalize on illiquidity if we believe the opportunity is attractive enough. Furthermore, we are willing to invest in companies which have listings in the developed world but whose businesses are in the emerging world. We will not ignore the Alibaba’s of the world simply because they are listed in New York.   


“Active Share” is another means of comparing a portfolio to an index. As defined by an academic study, active share is the proportion of stock holdings that are different from the composition found in its benchmark.[6] So, for example, a mutual fund with an active-share percentage of 60% means that 60% of its assets differ from its index, while the remaining 40% mirrors the index. The study found a positive correlation between a fund’s active share and that fund’s performance against its benchmark. As you might expect, Kuroto’s active share is 98.5% and only four of Kuroto’s holdings are even in the MSCI EM ETF, representing a scant 1.3% of its holdings. 


One reality of the substantial difference between Kuroto and the index is that should one of the large representative EM markets rally over a given time period, we will underperform the index. A perfect example of this is the recent, dramatic increase in the China H-share market. The relaxed restrictions by the China Securities Regulatory Commission on domestic mutual funds investing in H shares pushed the MSCI China Index up 16.7% in April. This performance, in part, pulled the MSCI EM Index up by 7.7% in April. Kuroto, obviously, missed the entirety of this rally. 


Kuroto is not opposed to owning companies in the index as long as they fit the following three criteria: meaningful undervaluation, high returns on capital, and superior management. Currently, we believe the more compelling investment opportunities aren’t in the index.


Kuroto is investing in the emerging world and so the comparisons to relevant indices are inevitable. But, as we’ve shown here, the portfolios are very different. Over short periods of time, the performance of the two may be similar as capital flows into and out of these markets in risk-on/risk-off gyrations. However, over the long run, we believe that Kuroto’s emphasis on quality, relative concentration, and a broader focus should produce a portfolio of high-quality, undervalued businesses which outperform the index.


Sincerely,


Andrew Ewert

Sean Fieler                   

Daniel Gittes

William W. Strong 

ENDNOTES

[1] Performance stated for Kuroto Fund, L.P. Class A on a net basis. An investor’s performance may differ based on timing of contributions, withdrawals, share class, and participation in new issues. Performance contribution as stated uses the fund’s dollar-weighted gross internal rate of return calculations derived from average capital and sector P&L. Sector performance figures are derived using monthly performance contribution calculations in US dollars, gross of all fees and fund expenses. P&L on bullion, cash, and currency forwards are excluded from the table. Rest of World is: Poland, U.K. (EM company), UAE, Peru, Russia, Chile, Colombia.


[2] MSCI EM Index positions are not publically available. Thus, the MSCI EM ETF (EEM) is used herein. Given the ETF largely mirrors the index, we’ve used the two interchangeably. 


 [3] Kuroto exposures as of 3.31.15. MSCI Emerging Market Indext ETF (EEM) used for analysis. EEM holdings as of 4.8.15.


[4] http://www.wsj.com/articles/south-korea-unveils-tax-on-corporate-cash-hoards-1407301382


[5] However, MSCI is currently working on a proposal to add businesses, like Alibaba, which do not have local listings


[6] “How Active is Your Fund Manager? A New Measure That Predicts Performance,” by K.J. Martijn Cremers and Antti Petajisto of the International Center for Finance at the Yale School of Management, August 2006.

By Kieran Brennan October 31, 2025
Dear Partners and Friends, PERFORMANCE Equinox Partners Precious Metals Fund, L.P. rose +36.2% in the third quarter of 2025 and is up +90.2% for the year-to-date 2025. By comparison, the Junior Gold Mining Index GDXJ rose +46.6% in the quarter and is up +132.7% for the year-to-date. Exploration stage companies were the best performing segment of the portfolio, appreciating +55.0% in the quarter. The spot gold price rose +18% in the quarter and is up +47% for the year-to-date. The letter that follows provides our thoughts on the outlook for the gold price and implications for the portfolio holdings. gold The gold bull market, initially driven by central bank buying, has evolved into an investor-driven dollar debasement trade. This second phase of the gold bull market is more explosive than the first because it draws on the approximately $470 trillion of the world’s wealth as opposed to the roughly $35 trillion of central bank balance sheets. If President Trump fans the dollar debasement fire by forcing a politicized Fed to cut rates, gold could rapidly displace the dollar as the world’s reserve currency. However, if President Trump takes a more nuanced approach to the Fed, gold should still displace the dollar as the world’s reserve currency over time with the competition between gold and the dollar taking longer to play out. Gold investors warning about fiat currency debasement is nothing new. That, after all, is why gold investors own gold in the first place. There’s also nothing new about most American investors ignoring these warnings. The dollar’s relative stability has long made concerns about dollar debasement appear quixotic. Since the early 1980’s, American inflation has been largely tolerable, the dollar has outperformed almost all other fiat currencies, and U.S. government bonds have been the safest asset to own in an economic downturn. The dollar has sloughed off so much criticism for so long that Janet Yellen likely did not imagine the chain of events that freezing Russia’s foreign exchange reserves would set into motion. With confidence in the dollar’s inertia and a bit of hubris, in our opinion, Secretary Yellen engineered the freezing of $300 billion of Russia’s foreign exchange reserves and put the world’s central banks on notice that their use of dollar reserves depends upon the tacit approval of the U.S. Treasury. Foreign governments, shocked by this policy change, sought to reduce their dependence on the U.S. Treasury and doubled their gold purchases to roughly $60-80 billion per year (potentially $100 billion in 2025). This increase in central bank gold demand drove the gold price up over +50% from March 2022 to March 2025. This bull market, in turn, gave gold the additional scale necessary to function as a more viable alternative to the dollar and damaged the dollar’s air of invulnerability. This two-fold outcome is problematic because inertia and a lack of alternatives were fundamental to the dollar’s stability. On the back of gold’s appreciation, long-ignored arguments of gold investors began sounding more plausible. Financial professionals accustomed to deriding gold investors and referring to them as insects began to worry that gold’s price action is telling them something important. Jamie Dimon aptly summed up the change of heart: “This is one of those times where it is semi-rational to own gold.” His comment captures both his continued distaste for gold and his willingness to own it. Despite the broadening acceptance of gold as an investment, markets remain skeptical of the underlying dollar-devaluation narrative. Inflation, a broad measure of the dollar’s strength, is just 2.8%. The 10-year U.S. Treasury yields 4.0%, indicating the bond market’s indifference to the dollar debasement narrative. Furthermore, the decline in the trade weighted dollar has partially reversed since early July. At this moment, the dollar debasement trade appears to be waiting for additional macroeconomic and geopolitical events to play out. Of these, none looms larger than President Trump’s effort to bend the Federal Reserve to his will. In January, the Supreme Court will likely allow President Trump to remove Federal Reserve Board Governor Lisa Cook, making the selection of the next Fed Chair even more important. If Trump nominates a loyalist like Kevin Hassett who appears more committed to pleasing the President than price stability, we could see broadening concern about the dollar’s store of value and a growing asset allocation into gold. In this hyper-politicized Fed scenario, gold could quickly become a $100 trillion dollar asset and displace the dollar as the world’s reserve currency. However, if Trump nominates an institutionalist like Chris Waller, the dollar debasement trade will likely remain in limbo for a while as markets suss out how much control Trump really has over the Fed. Either way, the U.S. bond market will not be allowed to freely adjudicate the outcome at the Fed. We expect both Treasury and Fed to proactively manage the yield curve during the particularly politically sensitive period when the Fed is cutting rates while inflation is above their stated 2% target. Treasury will keep longer-dated bond issuance to a minimum while coercing banks to keep the Treasury market well bid. JP Morgan increased its holdings of Treasuries by $80 billion in the first half of this year, and we expect other banks to follow suit. The Fed, for its part, has announced an end to quantitative tightening and its intention to shift its balance sheet from mortgage-backed securities to Treasuries. Given the likely extent of the coordinated intervention of the Treasury and Fed, the bond market will not be a good indicator of the market’s confidence in Trump’s economic policies. Gold will be. To the extent that investors sense that the bond market is not providing a reliable price signal, they will begin paying more attention to gold. And, should the gold price becomes the accepted indicator of U.S. financial health, the Trump administration will take action to influence it. At the very least, this will entail the Trump administration encouraging other central banks to stop buying gold or even sell gold. But the anti-gold policy options are limitless. Needless to say, the U.S. government pushback on gold will not solve the dollar’s long-term structural problems. Nor will it mark the end of gold’s challenge to the dollar. It will simply mark the next phase of financial repression. Our Gold Mines The second phase of the bull market in gold has been broadly positive for our portfolio, as a portion of the investor money flowing into gold has bid up gold mining equities as well. Where central banks buy the physical gold bullion, private wealth investors allocating to gold will also buy gold mining stocks. The GDXJ Junior Mining Index is up +132.7% for the year-to-date through September 30. Even with this year’s rapid rise in the gold mining portfolio, valuations remain cheap at spot gold prices. Our in-production portfolio trades at a 24.0% IRR as compared to a 23.4% IRR on March 31. The most dramatic mis-valuation among our gold miners continues to be in the pre-production companies. While these equities have appreciated more rapidly than our producing companies for the year-to-date 2025, they began from such a low valuation that even at twice or three times their January price, they are still undervalued. Troilus Gold, a junior gold mining company with an 11.2 million ounces gold-equivalent resource in Quebec, Canada, is a case in point. Troilus Gold shares have more than tripled in 2025, rising from C$0.31 to C$1.35 per share. The company still trades at an IRR of 30%, 0.2x price-to-NAV (using a 10% discount rate), and a price per ounce of recoverable gold of $63. When Troilus goes into commercial production in 2029, we expect it will generate annual net income roughly equal to its current market cap. Troilus historically traded at an extremely low valuation because the market did not believe that the company could finance the project's upfront capital expenditure of $1.3 billion. Throughout 2025, Troilus began addressing these financing concerns by signing an offtake agreement with a European smelter and a related letter of intent for $700 million of debt financing on attractive terms. If Troilus Gold raises the necessary equity and signs a streaming arrangement to fully fund the mine’s construction, we believe the stock will trade much closer to its NAV (using a 10% discount rate and the spot gold price) of $2.5 billion.
By Kieran Brennan October 30, 2025
Dear Partners and Friends, PERFORMANCE Equinox Partners, L.P. rose +24.5% net of fees in the third quarter and is up +54.4% for the year-to-date 2025. By comparison, the S&P 500 index rose +8.1% in the third quarter and is now up +14.8% for the year-to-date 2025. Our quarterly performance has been almost exclusively driven by our gold and silver miners. In the third quarter, the spot gold price rose +18%, and the fund’s mining portfolio returned +40%. As of this writing, 78% of Equinox Partners’ capital is invested in the gold and silver sector. The letter that follows provides our thoughts on the gold price and our gold mining holdings. Gold The gold bull market, which was initiated by central bank buying, has evolved into an investor-driven dollar debasement trade. This second phase of the gold bull market is more explosive than the first because it draws on the approximately $470 trillion of the world’s wealth as opposed to the roughly $35 trillion of central bank balance sheets. If President Trump fans the dollar debasement fire by forcing a politicized Fed to cut rates, gold could rapidly displace the dollar as the world’s reserve currency. However, if President Trump takes a more nuanced approach to the Fed, gold should still displace the dollar as the world’s reserve currency over time with the competition between gold and the dollar taking longer to play out. Gold investors warning about fiat currency debasement is nothing new. That, after all, is why gold investors own gold in the first place. There’s also nothing new about most American investors ignoring these warnings. The dollar’s relative stability has long made concerns about dollar debasement appear quixotic. Since the early 1980’s, American inflation has been largely tolerable, the dollar has outperformed almost all other fiat currencies, and U.S. government bonds have been the safest asset to own in an economic downturn. The dollar has sloughed off so much criticism for so long that Janet Yellen likely did not imagine the chain of events that freezing Russia’s foreign exchange reserves would set into motion. With confidence in the dollar’s inertia and a bit of hubris in our opinion, Secretary Yellen engineered the freezing of $300 billion of Russia’s foreign exchange reserves and put the world’s central banks on notice that their use of dollar reserves depends upon the tacit approval of the U.S. Treasury. Foreign governments shocked by this policy change sought to reduce their dependence on the U.S. Treasury and doubled their gold purchases to roughly $60-80 billion per year (potentially $100 billion in 2025). This increase in central bank gold demand drove the gold price up over +50% from March 2022 to March 2025. This bull market in turn gave gold the additional scale necessary to function as a more viable alternative to the dollar and damaged the dollar’s air of invulnerability. This two-fold outcome is problematic because inertia and a lack of alternatives were fundamental to the dollar’s stability. On the back of gold’s appreciation, long-ignored arguments of gold investors began sounding more plausible. Financial professionals accustomed to deriding gold investors and referring to them as insects began to worry that gold’s price action is telling them something important. Jamie Dimon aptly summed up the change of heart: “This is one of those times where it is semi-rational to own gold.” His comment captures both his continued distaste for gold and his willingness to own it. Despite the broadening acceptance of gold as an investment, markets remain skeptical of the underlying dollar-devaluation narrative. Inflation, a broad measure of the dollar’s strength, is just 2.8%. The 10-year U.S. Treasury yields 4.0%, indicating the bond market’s indifference to the dollar debasement narrative. Furthermore, the decline in the trade weighted dollar has partially reversed since early July. At this moment, the dollar debasement trade appears to be waiting for additional macroeconomic and geopolitical events to play out. Of these, none looms larger than President Trump’s effort to bend the Federal Reserve to his will. In January, the Supreme Court will likely allow President Trump to remove Federal Reserve Board Governor Lisa Cook, making the selection of the next Fed Chair even more important. If Trump nominates a loyalist like Kevin Hassett who appears more committed to pleasing the President than price stability, we could see broadening concern about the dollar’s store of value and a growing asset allocation into gold. In this hyper-politicized Fed scenario, gold could quickly become a $100 trillion dollar asset and displace the dollar as the world’s reserve currency. However, if Trump nominates an institutionalist like Chris Waller, the dollar debasement trade will likely remain in limbo for a while as markets suss out how much control Trump really has over the Fed. Either way, the U.S. bond market will not be allowed to freely adjudicate the outcome at the Fed. We expect both Treasury and Fed to proactively manage the yield curve during the particularly politically sensitive period when the Fed is cutting rates while inflation is above their stated 2% target. Treasury will keep longer-dated bond issuance to a minimum while coercing banks to keep the Treasury market well bid. JP Morgan increased its holdings of Treasuries by $80 billion in the first half of this year, and we expect other banks to follow suit. The Fed, for its part, has announced an end to quantitative tightening and its intention to shift its balance sheet from mortgage-backed securities to Treasuries. Given the likely extent of the coordinated intervention of the Treasury and Fed, the bond market will not be a good indicator of the market’s confidence in Trump’s economic policies. Gold will be. To the extent that investors sense that the bond market is not providing a reliable price signal, they will begin paying more attention to gold. And, should the gold price becomes the accepted indicator of U.S. financial health, the Trump administration will take action to influence it. At the very least, this will entail the Trump administration encouraging other central banks to stop buying gold or even sell gold. But the anti-gold policy options are limitless. Needless to say, the U.S. government pushback on gold will not solve the dollar’s long-term structural problems. Nor will it mark the end of gold’s challenge to the dollar. It will simply mark the next phase of financial repression. Our Gold Mines The second phase of the bull market in gold has been broadly positive for our portfolio, as a portion of the investor money flowing into gold has bid up gold mining equities as well. Where central banks buy the physical gold bullion, private wealth investors allocating to gold will also buy gold mining stocks. The GDXJ Junior Mining Index is up +131% for the year-to-date through September 30. Even with this year’s rapid rise in the gold mining portfolio, valuations remain cheap at spot gold prices. Our in-production portfolio trades at a 24% IRR as compared to a 25% IRR on March 31. The most dramatic mis-valuation among our gold miners continues to be in the pre-production companies. While these equities have appreciated more rapidly than our producing companies for the year-to-date 2025, they began from such a low valuation that even at twice or three times their January price, they are still undervalued. Troilus Gold, a junior gold mining company with an 11.2 million ounces gold-equivalent resource in Quebec, Canada, is a case in point. Troilus Gold shares have more than tripled in 2025, rising from C$0.31 to C$1.35 per share. The company still trades at an IRR of 30%, 0.2X its NAV (using a 10% discount rate), and a price per ounce of recoverable gold of $63. When Troilus goes into commercial production in 2029, we expect it will generate annual net income roughly equal to its current market cap. Troilus historically traded at an extremely low valuation because the market did not believe that the company could finance the project's upfront capital expenditure of $1.3 billion. Throughout 2025, Troilus began addressing these financing concerns by signing an offtake agreement with a European smelter and a related letter of intent for $700 million of debt financing on attractive terms. If Troilus Gold raises the necessary equity and signs a streaming arrangement to fully fund the mine’s construction, we believe the stock will trade much closer to its NAV (using a 10% discount rate and the spot gold price) of $2.5 billion. New Board Seat at Gran Tierra Energy On September 30, portfolio company Gran Tierra Energy announced that Brad Virbitsky has joined the board on behalf of Equinox Partners. While it is a relatively modest-sized position in the fund, we believe there is significant value to unlock, and we can help realize that value through our participation in the boardroom.
By Kieran Brennan October 30, 2025
Kuroto Fund Wins HFM 2025 US Performance Award
By Kieran Brennan October 30, 2025
Dear Partners and Friends, PERFORMANCE Kuroto Fund, L.P. appreciated +16.6% in the third quarter and is up +51.6% year-to-date 2025. By comparison, the broad MSCI Emerging Markets Index rose +11.0% in the third quarter and is up +28.2% for the year-to-date. Performance in the quarter was driven primarily by our investments in Nigeria, with additional strong contribution from our largest position, MTN Ghana. A breakdown of Kuroto Fund exposures can be found here . Portfolio Changes During the third quarter, we initiated a position in Solidcore Resources, a company described in our February webinar . Solidcore is similar to the oil companies we profiled in our Q2 2025 letter in that it is a competitively advantaged commodity producer. The company’s main asset is a long-lived and low-cost mine, the management team is among the best in the region, and the infrastructure they are building will make them a natural consolidator of regional assets. Given the subsequent increase in commodity prices, we ended up purchasing the bulk of our position at a 40%+ free cash flow yield. Solidcore is now a top 5 position in the fund. We funded our purchase of Solidcore by reducing our Georgia Capital position weighting from 17% to 11% and by selling our stake in a Greek consumer-focused business. In the case of Georgia Capital, while the discount to the sum of the parts value decreased from 50% to a more reasonable 30%, we still see it as a compelling investment opportunity. Georgia Capital’s portfolio of oligopolistic businesses is growing earnings double digits, buying back stock, and trading at a single digit, look-through price-to-earnings multiple. The sale of our Greek investment was driven by stock appreciation combined with a management change that led us to re-underwrite our investment. GHANAIAN AND NIGERIAN MACRO Over the past decade, Nigeria and Ghana have endured a seemingly unending series of self-inflicted macro problems. Inflation increased to over 30% in both countries, and the currencies depreciated 64% and 79%, respectively. Ghana defaulted on its domestic and foreign debt in 2023, and Nigeria imposed onerous capital controls for multiple years. However, 2025 has been a turning point for both countries. For the first time in over a decade, investors in these markets are experiencing macroeconomic tailwinds. In Ghana, since the beginning of the year, the currency has appreciated 43% vs. the U.S. dollar, GDP growth averaged over 6%, the budget has been in primary surplus, inflation declined from 24% to 9%, and debt to GDP declined from 62% to 43%. Ghana’s macro environment has improved due to three factors: One, Ghana’s debt restructuring is mostly finished, and the country now has a much smaller interest expense burden, which should decline further as the central bank lowers rates to be more in line with the decline in inflation. Two, the new government which assumed power in January has cut spending 14% in real terms. Three, the country has been helped by the large increase in the gold price, which is both the country’s largest export and a significant component of Ghanaian central bank reserves. Ghana now has 4.8 months of import cover, half of which is held in gold bullion. Whether Ghana can maintain this strong start to the year is an open question, but the fundamentals are certainly in a better place than they have been in the past decade. In Nigeria, President Tinubu’s bold reforms upon taking office are finally starting to have some effect. In 2023, Tinubu eliminated the local fuel subsidy which consumed about 40% of the government’s annual revenues, floated the currency which resulted in a 68% depreciation, forced a recapitalization of the banking sector, and removed the board of the notoriously corrupt national oil company and replaced them with technocrats who formerly worked at companies like Exxon and Shell. While not perfect, the scale of the reforms is impressive by any standard. A year later, inflation has fallen from over 30% to the high teens and is expected to fall to single digits next year. Economic growth has increased from less than 3% to over 4%. Oil production is up more than 10% and oil theft is down 90%. Importantly, the exchange rate has been stable for a year and anecdotally, we are hearing that conditions on the ground are night and day different, businesses are looking to invest, and banks are willing to lend. We initially invested in Ghana and Nigeria in 2018 with the expectation that both countries would eventually adopt a sane set of macroeconomic policies. While it took longer than we expected, sane policy is gaining traction in both countries, and our superior companies are getting re-rated to more sensible, albeit still very cheap, valuations. In Ghana, our main investment has been in MTN Ghana, which has compounded at approximately 25% in U.S. dollar terms since 2018 despite all the on-the-ground challenges. The stock’s historical return understates our investment performance because we increased our weighting at opportune times. The total contribution to our P&L has been +$17.7 million over that time frame, resulting in a +24.9% cumulative contribution to fund returns. Our Nigerian investment results have also been strong. While our initial entry was poorly timed, we added counter-cyclically, and as a result have generated +$9 million of P&L, contributing a cumulative +15.0% to the fund’s return. Our experience in both markets underscores the importance of our investment strategy of looking at out-of-favor markets to find competitively advantaged, well-run businesses at unusually cheap valuations. NEW BOARD SEAT AT GRAN TIERRA ENERGY On September 30th, portfolio company Gran Tierra Energy announced that Brad Virbitsky has joined its board on our behalf. While it’s a relatively modest position size in the fund, we believe there is significant value to unlock and we can contribute to that process through our participation in the boardroom. Sincerely, Sean Fieler & Brad Virbitsky
By Kieran Brennan August 1, 2025
Dear Partners and Friends, PERFORMANCE Equinox Partners Precious Metals Fund, L.P. rose +13.2% in the second quarter of 2025 and is up +39.7% for the first half of 2025. By comparison, the Junior Gold Mining Index GDXJ rose +18.7% in the quarter and is up +58.7% for the first half of the year. Our meaningful year-to-date underperformance relative to the GDXJ reflects the continued discount at which our companies trade compared to peers. Specifically, our portfolio of producing companies trades at an average internal rate of return (IRR) of 24%, roughly double the 11.5% IRR of the broad universe of gold miners that BMO covers. the gold mining bull market is young The skepticism that characterizes the gold mining sector stands in sharp contrast to the enthusiasm in the broader stock market. The animal spirits that have propelled popular stocks like Wingstop and Robinhood to an average of nearly 80 times 2025 earnings remain totally absent among gold mining investors. One indication of the sober mood that dominates the gold mining sector is the use of gold price assumptions below spot in net asset value (NAV) calculations. Looking at four important sell-side houses for the sector, their models include an average long-term price assumption of $2,400 per ounce, representing a 28% discount to the quarter-end spot price. 
By Kieran Brennan July 24, 2025
Dear Partners and Friends, PERFORMANCE Equinox Partners, L.P. rose Equinox Partners, L.P. rose +11.6% net of fees in the second quarter and is up +24.1% for the year-to-date 2025. By comparison, the S&P 500 index rebounded +10.9% in the second quarter and is now up +6.2% for the year-to-date 2025. Our portfolio has performed well across the board this year, with our gold miners, oil and gas producers, and emerging market businesses all appreciating. We were particularly gratified by the long-overdue outperformance of several of our earlier stage gold companies in the first half of this year. With markets and complacency on the rise, we think it prudent to address the non-negligible risk of an economic downturn. Beware the Next Recession 
By Kieran Brennan July 23, 2025
Dear Partners and Friends, PERFORMANCE Kuroto Fund, L.P. appreciated +21.3% in the second quarter and is up +30.1% for the first half of 2025. By comparison, the broad MSCI Emerging Markets Index rose +12% in the second quarter and is up +15.3% for the first half of 2025. Key performance drivers for the fund have been our large position in MTN Ghana, as well as the strong returns from our holdings in Nigeria and the Republic of Georgia. A breakdown of Kuroto Fund exposures can be found here . Despite Kuroto Fund’s outperformance in the first half of the year, our portfolio remains very attractively valued. Given the diversity of business models we own, it is difficult to find metrics that provide an accurate picture of the value and quality of our portfolio in the aggregate. In the absence of an alternative, our portfolio’s weighted average price-to-earnings multiple of 7.3x 2025 earnings, dividend yield of 5.2% and ROE of 24.7% will have to do.
By Dan Donohue May 1, 2025
Dear Partners and Friends, PERFORMANCE Equinox Partners Precious Metals Fund, L.P. rose +23.4% in the first quarter of 2025. Over the same period the price of gold rose +18.9%. The fund’s performance was driven by strong returns from both the producing and exploration stage companies as gold crossed $3,000 per ounce. Trump's New Economic Policy Trump’s New Economic Policy has roiled markets and bolstered investor gold buying globally. While the violent market gyrations remain a focus for our team, we have also been thinking through the long-term effects of Trump’s policies. In this latter endeavor, Nixon’s 1971 New Economic Policy has proven an invaluable guide. The policy similarities between Nixon’s first term and Trump’s second are striking. Both presidents declared emergencies, raised tariffs, cut spending, reduced foreign aid, blamed foreigners, devalued the dollar , proposed tax cuts, attacked the Federal Reserve chair, and directly managed consumer prices. There are, of course, also meaningful differences. Most notably, Trump has raised tariffs more, devalued the dollar less, and has not imposed formal wage and price controls. Nevertheless, the policy resonance is striking.
By Kieran Brennan April 30, 2025
Dear Partners and Friends, PERFORMANCE Kuroto Fund, L.P. appreciated +7.3% in the first quarter of 2025, while the broad MSCI Emerging Markets index rose +3.0%. Kuroto performance for the quarter was driven primarily by the strong performance of our operating companies in Georgia and Ghana. A breakdown of Kuroto Fund exposures can be found here . Returning to Brazil Though the Kuroto Fund didn’t invest outside of Asia until 2014, as a firm we began investing in Brazil in the late 1990s and made our first sizable investment there in 2004. We have followed the market ever since. Given our love for the country of Brazil and admiration for many of the companies there, it has been challenging for us to remain mostly absent from Brazilian capital markets for the past decade. We stayed away for a variety of reasons, but primarily because we didn’t like the valuations on offer. So it is with more than a bit of enthusiasm that we were able to make two substantial investments in Brazil this January, taking our portfolio weighting in the country from 0% to 10%. Brazil remains a macroeconomic and political adventure, but today’s valuations are incredibly attractive. The Brazilian stock market is down over 40% in US dollars over the past 14 years. 
More Posts