Equinox Partners, L.P. - Q4 2011 Letter

Dear Partners and Friends,

PERFORMANCE & PORTFOLIO

Equinox Partners fell -1.3% in the quarter ended December 31, 2011. In 2011, Equinox Partners declined    -28.0%. In January, the fund was up +11.8%.

Equinox’s decline in 2011 surpassed that of the Credit Crisis in 2008, previously our largest annual drawdown. Whereas profits on our short positions partially offset some of the losses on our long positions in 2008, last year, Equinox lost money on all four of our major themes (i.e., long superior operating businesses in emerging markets, long energy and gold mining companies, and short developed world sovereign debt). Because our longs declined much less in 2011 than 2008, they are nowhere near as cheap as they were at the lows of 2008. Consequently, we do not expect a repeat of the dramatic rebound that we experienced in 2009.

Correlation


While the financial results of domestically-oriented Brazilian and Indian companies have little to do with one another, in 2011 the stock market traded the two as though they were rough equivalents. As a result of this increased correlation, our globally diversified portfolio of fifty companies across 14 countries provided little daily diversification.

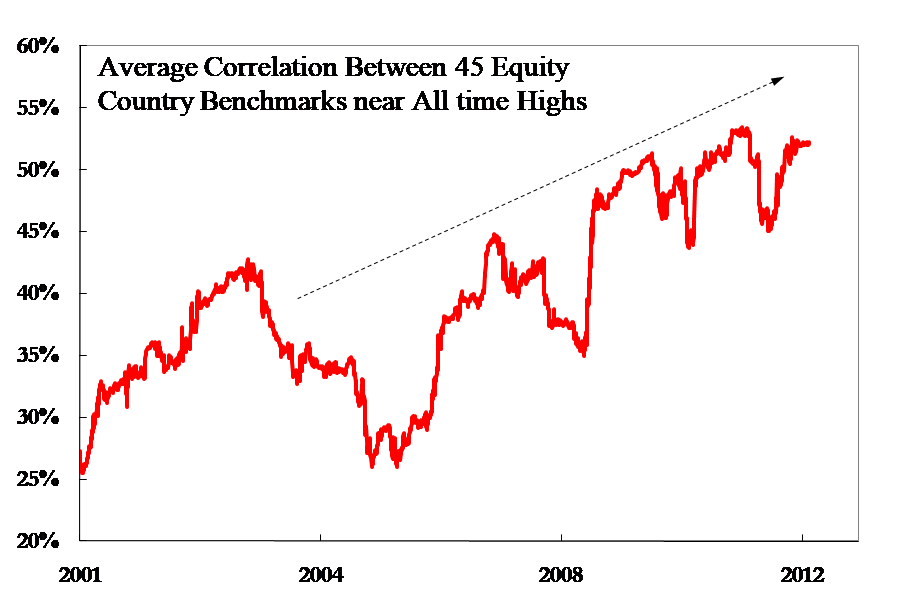
To many, rising price correlations across countries appear to be the inevitable consequence of an increasingly interconnected world. But, this simplistic view over weights the importance of increased information flows and mischaracterizes the significance of growing global trade. With respect to information flows, for example, Greece’s debt crisis has captured the entire world’s attention in a way that is completely out of proportion with its actual economic significance. With respect to global trade, its persistent growth belies the emerging markets’ deliberate use of trade to insulate their economies from, rather than integrate their economies into, the global economy.  


When Equinox Partners opened its doors seventeen years ago, much of the Emerging World was dependent upon short-term dollar borrowings to finance their large current account and fiscal deficits, and predictably, whenever the Developed World so much as sneezed, the Emerging World got pneumonia. The method of transmission was perfectly clear: as liquidity dried up in the Developed World, currencies of countries that needed to rollover foreign debt declined, thereby making the debt rollover more difficult, which in turn aggravated the currency declines. Today, the underlying fundamentals are almost exactly reversed, despite increases in global trade. Having diligently exported their way to massive trade surpluses over the past decade, the Emerging World now holds trillions of dollars in foreign exchange reserves. These reserves have reduced the Emerging World’s dependence on Developed World capital markets for debt financing and have consequently put the Emerging World in an excellent position to be protected against global economic shocks. 

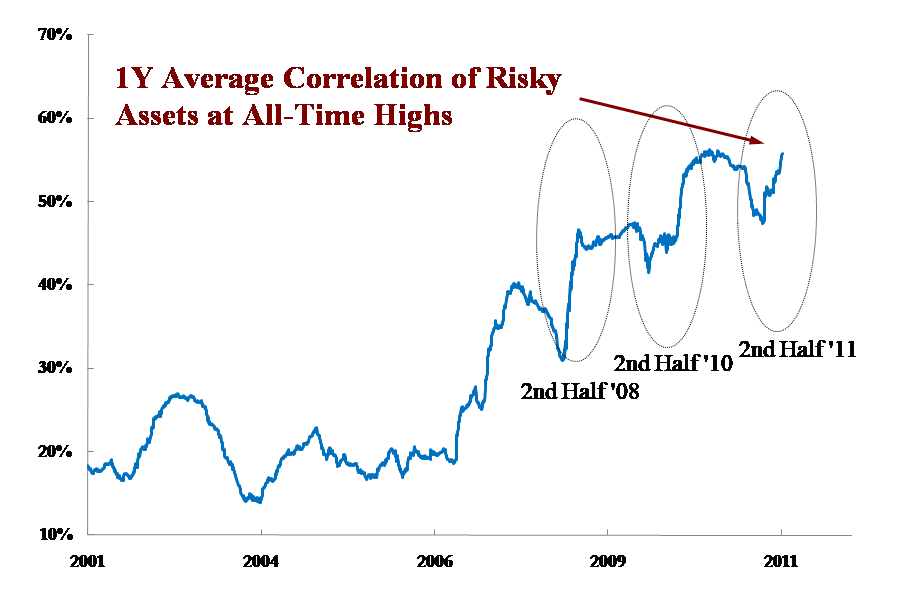
Furthermore, that the correlation of almost all financial assets including commodities (see graph above) is increasing both within and across countries, suggests that it is the unit of account, not the underlying assets, that is changing in value. We are not claiming that the US dollar’s purchasing power is fluctuating widely, but that periodic deflationary and inflationary scares are just another way of describing wide fluctuations in the US dollar’s perceived future purchasing power. This looming threat of monetary instability—not growing global interconnectedness—best explains the recent remarkable increase in the correlation of assets within and across national borders. As the unit of account appreciates and depreciates, it is everything else that appears to go up and down.


Staying the Course

While more than thirty years have passed since Americans have had to contend with actual dollar instability, it is for good reasons that the experience of investing against a backdrop of dollar volatility is still seared into the memory of anyone who lived through the 1970s.  For most equity investors, the experience was trying. Not only did the dollar lose more than half of its value over the course of the decade, but the dollar volatility and corresponding policy responses induced a series of massive rallies and breathtaking declines in stock prices. The graph below shows the price movement of the Dow Jones Industrial Average in the 1970s and graphically illustrates this rollercoaster ride of a decade.


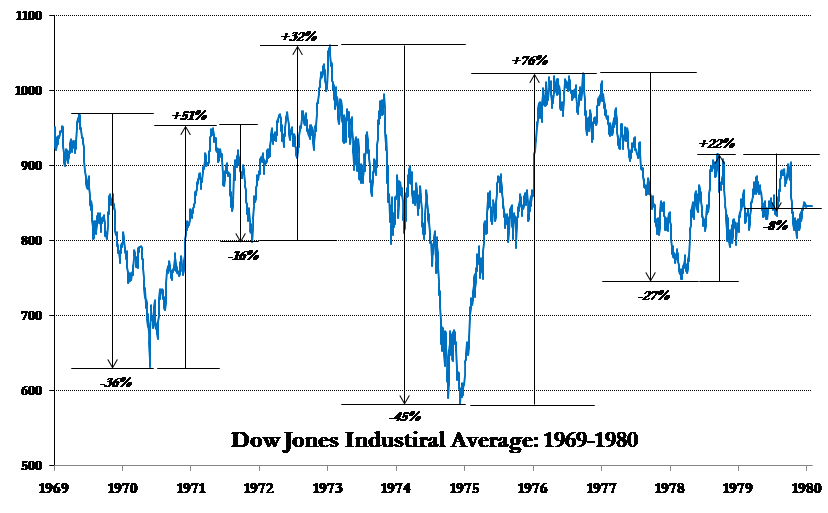
Looking at the above chart, it is easy to conclude that one must actively trade in times of monetary instability. This is exactly wrong. Not only are the rallies and declines unpredictable, but a focus on trading can obscure the long-term opportunity to buy great businesses at exceptional prices. Rather than attempting to time the market, a few particularly thoughtful investors, such as Warren Buffett and Bill Ruane, recognized that the indiscriminate buying and selling by other market participants created exceptional opportunities for patient, disciplined investors. As a reward for their disciplined approach, they both compounded their capital at admirable rates over the course of the decade.


The sine qua non of a long-term value approach in a turbulent market is the ability to identify businesses that will grow profitably despite a challenging economic backdrop. On this point, based on our estimates, we are pleased to report that the earnings of our portfolio companies grew at +16% last year on a look-through basis.


As we remain disciplined value investors in what promises to be a volatile period, we hope that our partners will realize that the good years aren’t as good as they seem, the bad years aren’t as bad as they seem, and that a volatile and indiscriminate market will inevitably provide us with opportunities to buy exceptional businesses at attractive valuations.


Privacy Policy

The world over, there is a growing sense that market forces need to be more closely managed by a political or expert authority. One manifestation of this growing sense is increased taxation and control over cross-border capital flows. As global investors, it should surprise no one that we have started receiving inquiries from governments about the nature of these capital movements. Last year, for example, we received requests from South Korea and Egypt asking us to verify that we have no Korean or Egyptian investors by disclosing the names and nationalities of our clients. We were able to comply with the request in these two cases by only disclosing the domicile and not the names of our investors. That said, we suspect that Korea and Egypt are merely ahead of the pack, and that going forward we will periodically be required, or incented, to disclose more information about our clients in order to invest in certain markets. You can be assured that we will always weigh these decisions carefully, disclosing the minimum amount of information necessary to achieve the preferred tax treatment. The larger point to grasp, however, is that we, like our competitors, will likely face increased regulatory pressure to disclose more client information to governments in the future.


Escape from New York

It is no secret that New York City is one of the most expensive jurisdictions to do business. Mayor Bloomberg has even referred to his city as a “luxury product.” While we are distressed by the City’s pricing power, we are even more distressed by the condition of the State’s finances. New York State’s pension liability is $120 billion underfunded[1] and, according to the New York State constitution, the benefits cannot be reduced in any way. This puts New York State in a difficult position, and makes tax increases extremely likely, if not quite inevitable in this already highly taxed jurisdiction.


Despite these likely tax increases, for our business purposes, New York City remains attractive—the benefits still outweigh the costs for this “luxury product.” But for the principals of the business, living in the City makes less and less sense. For Bill Strong in particular, who pays more in city and state taxes than he does in federal taxes, is not focused on the daily operations of the business, and can participate in the investment decisions remotely, the incentive to relocate to a lower cost jurisdiction is too attractive to ignore. 


Accordingly, Bill has purchased a home in Florida, a state, not incidentally, with no income tax. He remains in good health and is not retiring (Bill doesn’t play golf). We are also restructuring his management company interest so that Bill can participate in the business through a Florida-based entity while retaining his significant financial stake in the business. He will maintain an office in Miami in order to keep regular hours and to easily communicate with our research team and investors. Bill will also travel back and forth to New York and will continue to take research trips with our analysts. If you’re wintering in the Miami area, we encourage you to please stop by and visit him. 


Sincerely,


Sean Fieler                   

Daniel Gittes

William W. Strong

END NOTES

[1] Empire Center for New York State Policy, EJ McMahon and Josh Barro, New York’s Exploding Pension Costs, December 2010. (Analysis includes both the New York Teachers’ Retirement System and the New York State and Local Retirement System using private-sector accounting standards to calculate funding shortfalls. Does not included $76 billion New York City pension unfunded liabilities.)

By Dan Donohue May 1, 2025
Dear Partners and Friends, PERFORMANCE Equinox Partners Precious Metals Fund, L.P. rose +23.4% in the first quarter of 2025. Over the same period the price of gold rose +18.9%. The fund’s performance was driven by strong returns from both the producing and exploration stage companies as gold crossed $3,000 per ounce. Trump's New Economic Policy Trump’s New Economic Policy has roiled markets and bolstered investor gold buying globally. While the violent market gyrations remain a focus for our team, we have also been thinking through the long-term effects of Trump’s policies. In this latter endeavor, Nixon’s 1971 New Economic Policy has proven an invaluable guide. The policy similarities between Nixon’s first term and Trump’s second are striking. Both presidents declared emergencies, raised tariffs, cut spending, reduced foreign aid, blamed foreigners, devalued the dollar , proposed tax cuts, attacked the Federal Reserve chair, and directly managed consumer prices. There are, of course, also meaningful differences. Most notably, Trump has raised tariffs more, devalued the dollar less, and has not imposed formal wage and price controls. Nevertheless, the policy resonance is striking.
By Kieran Brennan April 30, 2025
Dear Partners and Friends, PERFORMANCE Kuroto Fund, L.P. appreciated +7.3% in the first quarter of 2025, while the broad MSCI Emerging Markets index rose +3.0%. Kuroto performance for the quarter was driven primarily by the strong performance of our operating companies in Georgia and Ghana. A breakdown of Kuroto Fund exposures can be found here . Returning to Brazil Though the Kuroto Fund didn’t invest outside of Asia until 2014, as a firm we began investing in Brazil in the late 1990s and made our first sizable investment there in 2004. We have followed the market ever since. Given our love for the country of Brazil and admiration for many of the companies there, it has been challenging for us to remain mostly absent from Brazilian capital markets for the past decade. We stayed away for a variety of reasons, but primarily because we didn’t like the valuations on offer. So it is with more than a bit of enthusiasm that we were able to make two substantial investments in Brazil this January, taking our portfolio weighting in the country from 0% to 10%. Brazil remains a macroeconomic and political adventure, but today’s valuations are incredibly attractive. The Brazilian stock market is down over 40% in US dollars over the past 14 years. 
By Kieran Brennan April 29, 2025
Dear Partners and Friends, PERFORMANCE Equinox Partners, L.P. rose +11.0% net of fees in the first quarter of 2025. Over the same period, the S&P 500 index declined -4.3%. Equinox’s performance was driven by the strength of our gold mining equity portfolio, most notably by our earlier stage exploration companies that rose dramatically as gold crossed $3,000 per ounce. Trump's new economic Policy As Trump’s New Economic Policy roiled markets, we selectively harvested short positions and increased our ownership in oil and gas companies at deeply discounted prices. Violent market gyrations remain a focus, but we have also been thinking through the long-term effects of Trump’s policies. In this latter endeavor, Nixon’s 1971 New Economic Policy has proven an invaluable guide. The policy similarities between Nixon’s first term and Trump’s second are striking. Both presidents declared emergencies, raised tariffs, cut spending, reduced foreign aid, blamed foreigners, devalued the dollar, proposed tax cuts, attacked the Federal Reserve chair, and directly managed consumer prices. There are, of course, also meaningful differences. Most notably, Trump has raised tariffs more, devalued the dollar less, and has not imposed formal wage and price controls. Nevertheless, the policy resonance is striking.
By Kieran Brennan April 8, 2025
Webinar Replay of Case Study presentation on Solidcore Resources
By Kieran Brennan February 26, 2025
Payne Points of Wealth Podcast - "The revenge of Inflation and Kazakhstan"
By Kieran Brennan January 18, 2025
Dear Partners and Friends, PERFORMANCE Equinox Partners Precious Metals Fund, L.P. fell -12.9% in the fourth quarter, finishing the year down – 2.9%. The fund’s performance reflects the lackluster performance of the gold mining sector as well as the underperformance of the companies we own. While there were some clear themes, such as producing companies outperforming exploration companies, our 2024 results are most accurately captured through a description of our six best and six worst performing investments during the year. These twelve companies capture every investment that contributed at least 1%, positive or negative, to our 2024 fund performance. A Challenging Year In 2024, the gold price finished up +27.4%. The GDXJ ETF which tracks the index of junior gold mining producers was up +15.7%. Our portfolio of miners in this fund was down -2.9%. The underperformance of the gold miners as compared to gold largely reflects government participation in the gold market. In 2024, governments bought gold, not gold miners. The poor performance of the gold miners also reflects the sector’s continued subpar returns on capital. The S&P TSX Global Gold universe, a group of large, mature gold miners, only generated an 11% ROE in 2024 and a 5.4% free cash flow yield according to RBC. Despite their inadequate returns on capital, producing miners handily outperformed most exploration and development companies. There remains almost no market for most gold mining companies that are years away from first production. As value investors with contrarian instincts, we have found the increasingly irrational valuations of the pre-revenue companies of particular interest. Often as a project advances, the equity market value of the company declines. These share price declines in turn create a self-reinforcing dynamic in which the small, cash-starved companies underperform because they don’t have access to the capital necessary to move their projects forward. At this point, the downward spiral of pre-revenue gold miners is very extended and nearing a floor in our opinion. Not only are the valuations of these companies incredibly low, but these companies have become increasingly attractive acquisition targets. Although exploration companies are the most severely discounted sector, 54% of our fund remains invested in producing companies. In general, our producing companies trade at a discount to the sector because they are executing on significant capex plans and lack free cash flow. During construction periods, the market can become excessively skeptical. This skepticism, in turn, can present an opportunity to buy high quality assets run by good management teams at attractive valuations. We believe that this is clearly the case at Eldorado Gold, K92 Mining, West African Resources and Adriatic Metals. Overall, our miners are incredibly cheap. Assuming a flat gold price, we estimate our producers will generate a 23.5% IRR. Our companies that do not yet generate any cash flow are cheaper still. Ascot, Thesis, Troilus and Goldquest, for example, have an average IRR of over 30% at current metals prices. Six Winners and Six Losers in 2024 Note: Below IRR is our Equinox internally calculated IRR based on 2024 year-end market prices and forecasted future FCF per share to equity. Borealis Mining: 2024 Performance +29%, IRR 48% Borealis was founded by Kelly Malcolm in 2023 to leverage a large heap leach facility in Nevada by acquiring nearby low-grade heap leach assets. We invested in a pre-IPO round at a $30M post-money valuation. At the time, Borealis had approx. $5M worth of crushed stockpiles, a fully permitted heap leach facility, ~60,000oz of reserves ready to be processed with limited capex and substantial exploration potential at depth. In late 2024, Borealis began to acquire nearby deposits. Borealis purchased Bull Run for $6M in cash. This translates to $14 per ounce for ~500,000oz of already defined resources, and confirms managements intuition that there are small, stranded assets for sale in Nevada. We expect Borealis to continue this acquisition strategy and ramp to become a ~75,000 oz per year producer. K92 Mining: 2024 Performance +22%, IRR 17% K92 controls the world-class Kainantu mine in the highlands of Papua New Guinea. This mine is a high-grade, low-cost asset with a 3 million oz resource at 7g/t. K92 produced 120,000 oz last year, and we expect the company’s Phase 3 expansion will take annual production to over 150,000 oz (gold equivalent) in 2025. While K92 has often struggled to meet its ambitious growth targets, the company has strung together two consecutive quarters of meaningfully higher production with higher than reserve grades. K92 recently expanded the milling capacity which had been a meaningful bottleneck for years. If the company can reach Phase 4, the Kainantu mine’s production will produce ~400,000 oz at a bottom quartile cash cost of <$1000/oz while maintaining a clean balance sheet with minimal leverage. West African Resources: 2024 Performance +38%, IRR 31% In 2024, West African Resources (WAF) remained on-time and on budget in the build of the company’s second mine in Burkina Faso, called Kiaka. Once Kiaka is commissioned in Q3 2025, WAF will be a ~450,000 oz annual producer for the next 10 years. While the construction has proceeded as expected, WAF was adversely impacted by the local content language in Burkina Faso’s new mining code. Rather than pay the resulting mark up in their rental of local equipment, WAF elected to purchase their mining fleet outright. This decision added $150 million to the company’s capital budget and resulted in a July equity raise of the same amount. While we were disappointed with the need for more equity capital, ultimately the raise will accelerate WAF’s buy-back and dividend plans. If the company continues to trade at the current valuation, we expect the board will announce a sizable share repurchase as soon as the company’s debt is repaid. Hochschild Mining: 2024 Performance +96%, IRR 18% Hochschild Mining (HOC) is a proven mine builder with the strategy of reinvesting free cash flow into new projects to grow production. In 2024, we visited their newly commissioned mine in Brazil, called Mara Rosa, which was successfully built on time and on budget. Mara Rosa will deliver a 20%+ project level IRR and highlights HOC's competence in executing medium-size projects in Latin America. We expect the company will be able to repeat this success with another mine in Brazil, the Monte Do Carmo project in the neighboring state of Tocantins. Big picture, HOC is a family-owned business with a goal of producing 500,000 ounces of gold per year by 2030. While we would prefer a return on capital goal rather than a growth target, we appreciate the straight-forward way the company organizes its operations, and we believe the company will not undertake projects with less than a 20% cash on cash IRR. Moreover, unlike many growth miners, when the company reaches their targeted 500,000 ounces of annual production – anticipated for 2030 - we expect HOC to transition to return free cash flow to shareholders. Galiano Gold: 2024 Performance +35%, IRR 29% Galiano has been busily working on a new mine plan which will be released on January 28th. We expect the company’s production guidance will increase as Galiano elects to move forward with the redevelopment of their higher grade Nkran pit. We also expect increased exploration spending in 2025 as the company ramps up work on their newly consolidated land package. We are expecting Galiano to guide to a production target of approx. 250,000 ounces per year by 2027. Even at this higher rate of production, we anticipate the company will be able to more than replace reserves given the prospectivity of the Asankrangwa gold belt in which they operate. While Galiano will have to reinvest the vast majority of its cash flow in growth in 2025 and 2026, the company should become a substantial free cash flow generator beginning in 2027. Solidcore Resources: 2024 Performance +22%, IRR 21% Solidcore, a spin-out from Polymetal, is a new position in our fund. Solidcore is run by CEO Vitaly Nesis, and controlled by Oman’s sovereign wealth fund. The company operates two long-lived mines in Kazakhstan and produces 480,000 ounces of gold annually at a competitive All-In Sustaining Cost (AISC) of $1,300/oz. With an EV/EBITDA multiple of 2.2x, Solidcore trades at an almost 50% discount to its peers. This undervaluation is largely due to the company’s sole listing on the Astana International Exchange in Kazakhstan. We expect Solidcore to generate roughly $400 million in free cash flow per year at current gold prices. In 2025 and 2026, this free cash flow will be invested in a new pressure oxidation autoclave. Beginning in 2027, we anticipate that $100 million USD of the company’s free cash flow will be distributed to shareholders. This prospective dividend along with the company’s plan to re-list on the London Stock Exchange offers two catalysts that should drive a significant re-rating. Orezone Gold: 2024 Performance -30%, IRR 27% While Orezone completed its initial build on time and on budget, the company failed to generate the free cash flow necessary to internally finance the expansion of its operations in Burkina Faso. The company’s reliance on high-cost diesel generators and an unreliable power grid proved particularly problematic. Largely due to higher-than-expected power costs, the midpoint of their AISC guidance increased by $100/oz from last year’s projection of $1,338/oz. Despite the elevated power costs, Orezone successfully closed their financing for the hard rock processing plant in December 2024. This financing will enable Orezone to increase annual production from approx. 120,000 oz in 2024 to ~180,000 oz in 2026. We expect 2025 to be a pivotal year for the company as they will begin to generate sufficient cash to pay down debt and continue building towards their 250,000 oz/year target. We are also encouraged by the company’s ongoing exploration program which has the potential to increase the Bombore’s mine life at higher grades. C3 Metals: 2024 Performance -62% C3 stock declined significantly in 2024 even as the company made significant progress advancing their projects in both Jamaica and Peru. With respect to their Jamaican asset, C3 Metals signed a joint venture agreement with the Stewart family, one of the wealthiest families on the island. C3 is now well-positioned to do a JV deal with a larger international mining company that can finance the costly deep holes necessary to test the porphyry copper deposit’s potential. In Peru, C3 Metals received a permit to access one of its land packages located just 40 kilometers east of MMG’s Las Bambas mine. This permit, which took years to secure, opens the door for further exploration in a proven copper-rich region. With the permit in hand, C3 Metals should be able to bring in a larger partner to drill out the asset. Troilus Gold: 2024 Performance -45%, IRR 35% In May 2024, Troilus submitted its feasibility study to the Canadian government. This new study detailed their plan to develop a 22-year open pit mine that would produce approx. 300,000 oz of gold per year. With current gold prices north of $2,600 and copper hovering around $4, the project will likely move forward. The company has received financial support from a handful of export credit agencies interested in its 10% copper production. Troilus is also in the final stages of submitting the Environmental and Social Impact Assessment (“ESIA”), another key milestone as they advance towards construction. Located 300 kilometers north of Chibougamau, Quebec, the Troilus project is a brownfield site in a favorable mining jurisdiction with the potential to become a Top 10 copper gold project in Canada. We are fans of CEO Justin Reid and believe in his ability to permit the project and advance it towards becoming a premier North American copper-gold producer. At a $4/oz equity market cap to gold equivalent ounces in ground ratio, we believe Troilus is one of Canada’s best leveraged investments to rising gold and copper prices. Ascot Resources: 2024 Performance -23%, IRR 38% Ascot Resources put its Premier gold project on care & maintenance in September of 2024. At the time, the company didn’t have enough ore coming from the underground mine to profitably operate the 2,500 tonnes per day mill. To rectify the lack of available ore, the company raised $43 million, extended the term of their debt, and decided to invest in an additional 2,500 meters of development before commissioning the mill. The board then made a change at CEO and brought in Jim Currie for his extensive underground mining experience and added our own Coille Van Alphen to the board. Underground development is currently underway, and we expect the mill to restart in Q2 2025. One more injection of capital will likely be required to ensure the company has a sufficient working capital buffer as they restart the mill. When the mine reaches commercial production, it will be able to generate a sustainable ~$100m of FCF per year which should translate into a stock price of at least $1 CAD per share. Great Pacific Gold: 2024 Performance -47% Great Pacific owns two highly prospective gold exploration projects in Papua New Guinea (PNG). Over the course of 2024, the company refined its exploration targets and drilled 5000m at its Kesar project in the highlands of PNG. The Kesar project looks to be an extension of nearby K92’s mine, and as such may be sold to K92. Great Pacific will begin drilling exploration targets at its second PNG property in Q2 of 2025. This property is a brownfield site with past production at a grade of more than 10 g/t. Great Pacific has a third asset in Australia, which we believe could be sold to fund the company’s exploration activities in PNG. Great Pacific is led by an excellent CEO in Greg McCunn. We got to know Greg through a previous investment in West Africa. As CEO, he brings the necessary vision, discipline, and accountability to an exploration company. We believe the company will deliver exploration success at their two PNG assets and ultimately enable Greg to create shareholder value in a variety of ways. GoGold Resources: 2024 Performance -24%, IRR 30% GoGold has been waiting two years for its permit in Mexico. The delay was caused by the previous Mexican President Andres Manual Lopez Obrador’s (AMLO) staunch opposition to new mining development. In the end, while neither of AMLO’s major proposed changes to the mining code passed, few mining permits of any kind were issued during his time in office. GoGold’s large cash buffer and existing heap leach operation enabled the company to wait out AMLO without needing to raise additional equity capital. We think their patience will soon be rewarded as the new administration of President Claudia Sheinbaum plans to process permit applications on their technical merits. In GoGold’s case, the technical merits of their Los Ricos South project are exceptionally strong with over 100 million oz of silver at an average grade of 276 g/t. Sincerely, Equinox Partners Investment Management
By Kieran Brennan January 17, 2025
Dear Partners and Friends, PERFORMANCE Equinox Partners, L.P. declined -6.5% in the fourth quarter of 2024, finishing the calendar year 2024 up +17.7% net of all fees. Our poor performance in the fourth quarter was driven by a sharp selloff in gold and silver miners despite a flat gold price during the period. 2024 Year in Review Crew Energy accounted for 100% of our fund’s performance in 2024. We offered a fulsome write-up of Crew in our third quarter letter and need not repeat the details of the acquisition by Tourmaline here, other than to note that the 72% premium resulted in an ~18% contribution to the fund’s total return. While there was significant movement among our other investments, their aggregate contribution was close to zero. This is a disappointing result given the significant progress many of our companies made last year. The market was not impressed by Paramount Resources’ sale of its core asset to Ovintiv for $3.3bn CAD. Nor did the market seem to care that Kosmos energy finally brought its flagship Tortue asset online in December. Thesis Gold’s positive feasibility study elicited an initial positive reaction, which was quickly reversed. Elsewhere, the market remains totally indifferent to the rapid progress that West African Resources is making at their Kiaka asset. While we understand that our sectors are out of favor, we would hope to see at least some of the value they are creating reflected in their stock prices in 2025. We’ve been busy over the past six months, establishing several sizable, new positions. We sold half of the Tourmaline shares we received in consideration for our Crew shares and used funds to make the following investments: an 11% portfolio weight in Solidcore Resources, an 8% position in Kosmos Energy, a 5% weighting in Ensign Energy, and a 5% weight in Gran Tierra Energy. Solidcore and Kosmos are both top five positions and receive a full writeup in the letter that follows. Ensign Energy is a North American energy service company, and Gran Tierra Energy is an E&P company with assets in Latin America and Canada. Both Ensign and Gran Tierra trade at particularly compelling valuations. investment Thesis Review for our top 5 Long Positions by Weight
By Kieran Brennan January 17, 2025
Dear Partners and Friends, PERFORMANCE Kuroto Fund, L.P. appreciated +6.5% in the fourth quarter of 2024 and finished the year up +11.1%. Performance for the quarter was driven primarily by the positive performance our operating company holdings in Nigeria, Ghana, and Georgia. A breakdown of Kuroto Fund exposures can be found here . 2024 Year in Review Kuroto’s top five investments made large strides last year. Seplat completed its ExxonMobil Nigeria acquisition, more than doubling its production, cash flow and reserves. Georgia Capital successfully sold a non-core asset and is in a good position to buy back a lot of stock this year. MTN Ghana saw strong operational performance while Ghana’s economy and currency stabilized. Guaranty Trust Bank completed a government-mandated equity raise, and Nigeria made steps towards stabilizing its economy. Lastly, Kosmos brought on its long-delayed Tortue LNG project. In each case, we believe the market has not adequately factored in the progress our companies have made, and we anticipate a more fulsome rerating of our top holdings in 2025.
By Kieran Brennan November 1, 2024
Dear Partners and Friends, PERFORMANCE Equinox Partners Precious Metals Fund, L.P. rose +3.1% in the third quarter and is up +11.0% through the end of September 2024. Performance for the quarter was driven primarily by our group of explorers, with additional positive contribution coming from the producing segment of the portfolio. These gains were partially offset by the decline of one of our development stage companies which has experienced delays and raised additional capital. As our gold miners have lagged the indices, a substantial valuation gap has opened between the largest gold miners in the industry and the producing companies we own. At spot pricing, consensus sell-side models have Agnico, Barrick, Kinross and Newmont delivering an IRR of just 3%. Our portfolio of producers, on the other hand, models out to an IRR of 20% using the same metals price assumptions. There's substantial value in the gold mining sector, but the largest companies are not the ones to own.
More Posts