Equinox Partners, L.P. - Q2 2015 Letter
Dear Partners and Friends,
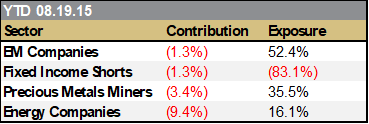
PERFORMANCE & PORTFOLIO
Equinox Partners was up +3.4% in the second quarter and up +2.0% for the year to date as of June 30. After substantial declines in July and thus far in August, we estimate the fund is down -16.7% for the year to date as of August 19.[1]
A bear market for equinox
This year’s poor performance comes on the back of four disappointing years and brings the fund’s cumulative decline to -45% through August 19. The extent and depth of this decline is close to our worst on record, nearly matching the six-year cumulative peak-to-trough decline of -46% that we posted in the 1990s.[2]
Like the late 1990s, over the past four years we have lost money as markets have ignored the fundamentals about which we are most concerned. Today’s impenetrable consensus reminds us of the herd mentality that supported the NASDAQ 100 at the end of the last century. Dollar strength and commodity weakness are not just positions; they are core beliefs. Consequently, China’s slowdown and the Fed’s rate hike are not just lived and priced in once. They are lived over and over again, priced in over and over again, until markets have reached extremes. This market even views the Chinese devaluation—in part an effort to move prices up by pushing a currency down—as commodity bearish. As painful as July was and August is turning out to be, we’ve now reached a point at which an alternative to the consensus must appear unimaginable to many market participants.
Large transfers of wealth occur at extremes like these. We remain well positioned for a first crack in the still impenetrable consensus with a portfolio of exceptional companies well aligned to both long-term micro and macro fundamentals. We don’t know what will shake markets out of their current mental rut, just as we didn’t know what would end the internet bubble of the late 1990s. We do know, however, that when ephemeral themes are treated as the world’s inevitable future, the eventual shift in expectations and prices is powerful.
the lower-for-longer mindset and our oil and gas producers
The shares of our low-cost shale producers and the oil futures curve have fallen precipitously over the past eight weeks. Accordingly, an update of our thoughts on both our companies and the oil price is merited.
When evaluating our oil and gas investments, we keep asking the same question. How fast can our companies sustainably self-finance production growth? Our investment thesis hinges on the answer to this singular question. For, if the companies we own cannot self-finance high rates of growth for long periods of time, then they are not great bargains at seven times next year’s cash flow. If, however, they are self-financing growth companies, then they are not just undervalued, they are severely undervalued.
Needless to say, the recent drop in oil and gas prices certainly complicates our answer to this all-important question of self-financing growth. While our companies have already booked large increases to production this year, we estimate that they require $3 gas and $60 oil to sustain double-digit growth in 2016 and beyond. Accordingly, today’s low energy prices put their growth and our thesis on hold. To be specific, at current strip prices, our largest holding, Paramount Resources, will likely elect to keep production flat and pay down debt next year. In short, Paramount Resources is no growth stock at today’s oil and gas prices.
The recent decline in oil prices derives from the consensus view that the modest oil surplus environment will persist beyond next year. Confidence in this view has pushed the price of oil well below its replacement cost in North America. Therefore, we do not believe that oil and gas prices can stay at current levels for long. The sustainable growth rate of our companies speaks powerfully to this point. Our companies are amongst the lowest cost and highest return in North America. If energy prices are so low that our companies are treading water rather than growing, then the average oil and gas company in North America will shrink. In an environment of supply destruction, the gap between supply and demand will be closed in a matter of quarters, at which point prices will have to rise dramatically to incentivize incremental supply.
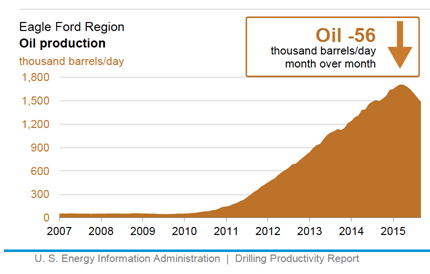
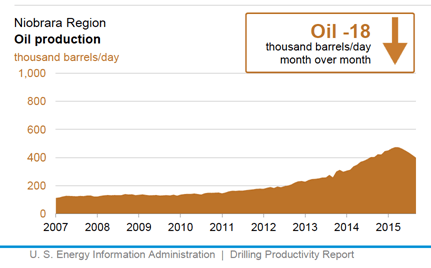
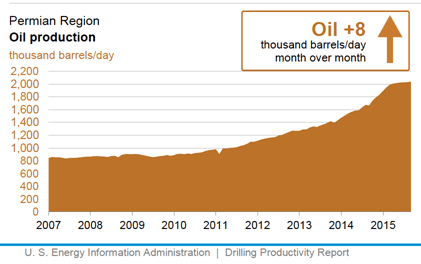
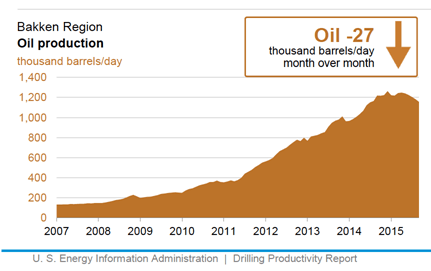
As we wait for the logic of supply and demand to drive energy prices higher, the impatient market has been trading almost exclusively on incremental information. Iran’s half million barrels of new supply and the recent uptick in US oil rigs are both certainly bearish, but their significance should not be overestimated. Together these data points are small potatoes compared to the global energy sector’s $200 billion of announced capital spending cuts, the five million barrels of daily future production that the industry has already shelved, and the actual downturn in US oil production (see graphs below). [3] With this perspective in mind, pundits confidently predicting sustained low prices should be taken with a grain of salt. When it comes to future price forecasts, we find PIRA Energy’s Gary Ross closer to the mark (click
here to read more.)
As important as it is to fully discount the challenges posed by today’s prices, we think it is far more important to recognize the select opportunities available at sustainable gas and oil prices. At $3 gas and $60 oil, our companies become self-financing, double-digit growers. The average North American shale company, by comparison, requires $65 oil just to begin growing.[4] The recycle ratio, a measure of a company’s ability to “recycle” current cash into future production, is the clearest way to quantify this distinctive characteristic of our companies.
Specifically, at August 17 strip pricing, our analysis shows our companies generating a recycle ratio of 1.7 in 2016.[5] Not only will our companies’ 2016 recycle ratios be superior to the industry, but we believe that our companies’ spread over the industry will be maintained for a decade or more as our companies exploit the highly economic land that they have already begun developing. The consistent quality of this future development simply makes it hard (read almost impossible) for others to catch up.
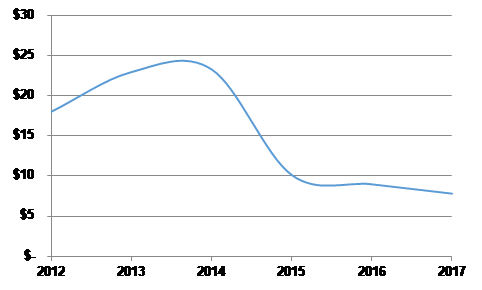
energy portfolio aggregate F&D Cost declines
This aforementioned predictability is driving an impressive drop in our companies’ finding and development (F&D) costs. Our research shows that our companies’ F&D costs will halve from 2012 to 2017 (see graph).[6] More importantly, we estimate that our companies’ F&D costs will remain at these low levels going forward. Therefore, at sustainable energy prices, our companies will grow rapidly. At higher energy prices, of course, our companies would grow faster still.
clarkson
When we began analyzing Clarkson, the world’s largest shipbroker, in the spring of 2012, we thought the company would likely provide good returns if shipping rates rose. Our work, however, uncovered a far more attractive thesis. While Clarkson does provide leverage to higher shipping rates, the company has consolidated the ship brokering market during the current downturn and, with each passing year, would be better positioned for the next bull market in shipping. In sum, the longer we wait for the cycle to turn the better the investment becomes. As this thesis has played out over the past three years, Clarkson has become a top-five holding in Equinox.
Clarkson has long had the best research in the shipping industry. Only Clarkson can consistently give customers the most relevant history about the particular vessels available for charter (e.g., not just their age, but their actual performance; not just current ownership, but their past ownership). In short, Clarkson is the best repository of important information that should influence the decision of the lessee. This unique intelligence not only supports Clarkson’s various research products but also translates into better brokerage relationships. People in the industry typically take their calls, and Clarkson almost always has a foot in the door. In an industry where everyone charges the same price, why wouldn’t you go to the guy with the best information?
When Andi Case took over as CEO in 2008, he sought to fundamentally transform Clarkson’s personality-driven brokerage business in order to solidify its leading position in the market. He insisted upon a team-based model in which no one broker controls a client and compensation is based on the performance of the desk. While the transition process was painful, the change has resulted in a more valuable firm with the ability to grow volumes. The results are incontestable. Clarkson has doubled market share over the past seven years.
In an effort to further distance themselves from their competition, last year Clarkson bought its largest competitor, Plateau. Plateau not only boosted Clarkson’s ship brokering market share, it cemented Clarkson’s place in a new segment: shipping finance and capital markets. As traditional participants have exited ship financing over the past seven years, an opportunity arose for a conservatively capitalized company like Clarkson to take share at attractive prices. While the combined financing business has gotten off to a slow start, we believe Clarkson’s finance capability will prove incredibly valuable over time.
Based on long-standing trends in global trade and Clarkson’s continued ability to take market share, we estimate that Clarkson can grow their volumes in the high single digits per year. Any rebound in the depressed shipping rates will be additive to this baseline of revenue growth. So, while we remain uncertain of the timing of such a rebound in the shipping market, we are confident that today’s ultra-low rates cannot be maintained indefinitely (bulk rates are down more than 60% from their 2008 peak–see graph below).
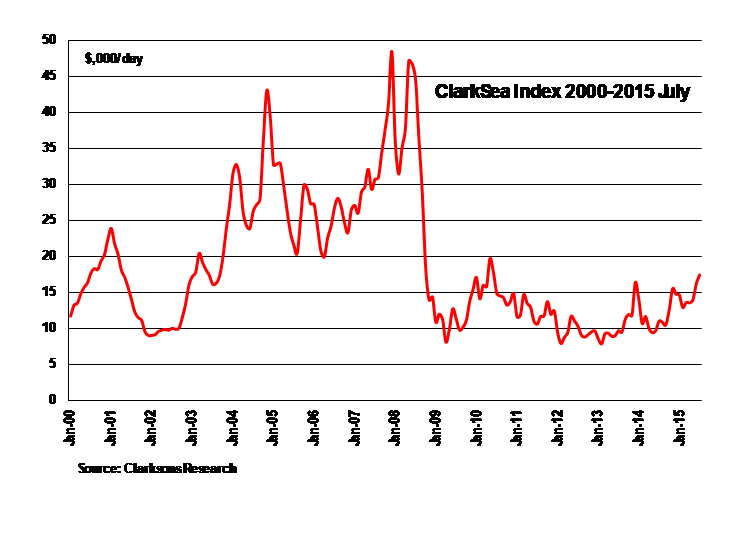
Shipping Rates
Persistently low shipping rates have not just held down Clarkson’s revenues, they have also held down Clarkson’s margins. Accordingly, slight increases in shipping rates would grow revenues and result in much faster rates of earnings growth at Clarkson. Furthermore, as almost no incremental capital investment would be needed to realize this growth, Clarkson would be in a position to pay out almost all of its earnings while growing. In sum, Clarkson is a good investment in a world of flat rates, and a great one in a world of increasing shipping rates; it’s an unusual combination that makes this an exceptional investment.
Sincerely,
Andrew Ewert
Sean Fieler
Daniel Gittes
William W. Strong
END NOTES
[1] Performance contribution as stated uses fund’s dollar-weighted gross internal rate-of-return calculations derived from average capital and sector P&L. Sector performance figures derived using monthly performance contribution calculations in US dollars, gross of fees and fund expenses. Interest rate swaps notional value included in Fixed Income exposure and contribution. P&L on cash and U.S. equity options excluded from the table as are market value exposures for derivatives.
[2] -40% performance January 1, 2011 through July 31, 2015. -46% performance November 1, 1994 through July 31, 2000. Not indicative of percentage to highwater mark.
[3] Financial Times, July 26, 2015, Oil groups have shelved $200bn in new projects as low prices bite. Raymond James, August 3, 2015, Energy Stat of the Week.
[4] Wall Street Journal, August 10, 2015, Oil Futures Signal Weak Prices Could Last Years.
[5] Our calculation is based on operating net backs of $15 and estimated F&D costs of $9 using a weighted average for the portfolio. Note that gas and oil companies can have vastly different average F&D costs and netbacks.
[6] Excludes one company in 2014 due to corporate actions which distort its F&D costs. 2012 and 2013 F&D costs for another company are excluded due to it being private at the time. F&D costs and netbacks for 2015-2017 derived from internal analysis and based on company and industry analysis.