Precious Metals Fund - Q2 2026 Letter

Dear Partners and Friends,


PERFORMANCE

Equinox Partners Precious Metals Fund, L.P. declined -6.0% in the second quarter of 2026, finishing the first half of the year up +1.3%. By comparison, in the second quarter, the price of gold declined -16.% and the MVIS Junior Gold Mining Index sold off -16.9%, finishing the first half of 2026 down -7.2% and -14.1% respectively. 


Performance for the quarter was driven by our exploration stage portfolio which in aggregate declined -9.3% amidst the declining gold price backdrop. Our portfolio of producing stage companies held up much better, only selling off -6.5%. Our largest producer, Solidcore Resources, was actually up +6% in the quarter. The portfolio also benefited from slightly elevated levels of cash, averaging 6% weight, which we were able to deploy part of as shares of our preferred companies returned back to our target IRR levels. 


Corporate Governance

Corporate governance analysis is central to our research process. We view our long-term investments in publicly traded companies as partnerships with a company’s board of directors. Accordingly, we don't just want to know what decisions a board is making; we know why a board is making decisions. In our opinion, understanding a board’s motivation is the best way to gain durable insight into their corporate strategy and capital allocation policy. 


Our emphasis on corporate governance has helped us avoid value traps and understand our portfolio companies better. Active engagement is more than informed proxy voting. Active engagement entails a sincere dialogue with directors. While the relationships required for an honest back and forth are not easy to achieve, conversations with directors have become a real differentiator for our research process. Our corporate governance successes have added meaningful value, and our corporate governance failures have taught us important lessons. While each governance situation is unique, we face several recurring problems of note: 


  1. Non-aligned directors: A surprising number of public company directors own little to no stock. These non-aligned directors fall into two categories: directors who lack sufficient wealth to own a meaningful amount of stock, and wealthy directors who choose not to own shares of the company that they govern. Both situations are problematic.
  2. Excessive executive option issuance: Ironically, the largest option grants tend to go to entrenched insiders that don’t need a payment to stay. As the interests of insiders and shareholders are clearly opposed in these cases, it is important that shareholders aggressively oppose excessive option issuance.
  3. Bundled voting: The sole purpose of bundling director elections is to reduce shareholder influence. The practice is gaining traction in Brazil, and we are actively opposing the trend.
  4. Stakeholder Capitalism: A theory typically used by boards to advance liberal environmental and social agendas that are at odds with shareholder interests. The resulting extreme ESG commitments can be both costly and morally objectionable. 
  5. Poison Pill Adoption: While there are valid reasons to adopt a poison pill, most of the time they are used to further entrench management and boards and should be opposed by shareholders.
  6. Change of control payouts: An egregious practice of paying insiders an additional bonus to sell the company. Such payments are indefensible and the wrong way to address the problem of entrenched insiders. 


Corporate governance engagement is an art that goes well beyond the application of a set of rules. We don’t vote against every flawed director or proposal. Instead, we seek to explain to board members why we oppose certain practices and expect a good faith effort from them to address our concerns. We aim for improvements, not perfection. 


Corporate Governance Insights Applied

The CEOs of Torex Gold Resources and B2Gold both announced their resignations in February of this year with gold trading north of $5,000 per ounce and gold mining equities indices hitting new highs. At both companies, the boards decided to promote the CFO to the open CEO role. In our opinion, these decisions reflect the boards’ intentions to prioritize the return of capital over growth strategies. Given the low valuations at which Torex and B2Gold currently trade, returning capital via share buybacks is especially accretive today. Accordingly, in both cases, the surprising leadership change made the companies more attractive investments, and we have been active buyers of both in recent months. 


Torex Gold Resources

On February 4th, Jody Kuzenko, Torex’s CEO, announced her resignation. Given that Jody is 56 years old, the market was surprised by her unexpected departure, and Torex’s shares gapped down -12% on the news. If everything were fine, why would Jody leave the company she worked so hard to build over the previous decade?


As long-term investors in Torex, we were in a great position to form our own opinion about Jody’s departure. Our conversations revealed two important things: First, Jody’s departure was a result of her sincere desire to take her career in a different direction and not the result of a problem at Torex. Secondly, Torex is going to generate an enormous amount of free cash flow, most of which will not be reinvested in mining activities, and Andrew Snowden, Torex’s CFO, is the right person to manage the capital return program. 


B2Gold

On February 24th, Clive Johnson announced his resignation as the CEO of B2Gold. Given he was 73 years old, his retirement was not as surprising. Clive was a gifted CEO but not a fan of returning capital to shareholders through dividends or buybacks. Accordingly, his resignation drove B2Gold up 13% over two trading days. 


In our opinion, the stock market was rightly concerned that Clive would always push to build or buy another mine. Clive’s departure and the elevation of Mike Cinnamond, the CFO, provides clarity on B2Gold’s capital allocation framework going forward. The company is clearly focused on “per-share” value creation, which has resulted in increased share buybacks and dividends. 


Conclusion

In both cases, the boards of Torex and B2Gold are prioritizing shareholder value over the “growth at any cost” mentality that has plagued the mining sector for decades. Our corporate governance engagement with these two companies provided us with a front-row seat to this important change that has not been fully appreciated by the market.


Organizational Update

In May, we added Roman Fuzaylov to our investment team. Roman has 20 years of experience as an investor across frontier and emerging markets. He started his career as a junior analyst at Prince Street Capital in 2006 and eventually became a partner and portfolio manager of their Tamerlane Fund, a regional mandate focused on Emerging Europe, Middle East and Africa. More recently, he was a co-portfolio manager of the Helios Seven Rivers Fund, a joint venture with Helios Investment Partners that focused on public markets investing across the African continent. Roman originally hails from Uzbekistan, is fluent in Russian, and is very well aligned with our long-term, fundamental approach to investing. 


In April, we hired Luca Grandinetti as a junior operations analyst. In addition to providing versatile support across our operations and middle-office functions, Luca has been instrumental in our Firm-wide efforts to centralize and organize the data around portfolio company corporate governance during proxy season. Prior to joining us, Luca worked at the Mitsui Group and Mirador, Inc. 


Sincerely,


Equinox Partners Investment Management

end notes

[1] Please note that estimated performance has yet to be audited and is subject to revision. Performance figures constitute confidential information and must not be disclosed to third parties. An investor’s performance may differ based on timing of contributions, withdrawals and participation in new issues.


Unless otherwise noted, all company-specific data derived from internal analysis, company presentations, Bloomberg, FactSet or independent sources. Values as of 6.3-.26, unless otherwise noted.


This document is not an offer to sell or the solicitation of an offer to buy interests in any product and is being provided for informational purposes only and should not be relied upon as legal, tax or investment advice. An offering of interests will be made only by means of a confidential private offering memorandum and only to qualified investors in jurisdictions where permitted by law.


An investment is speculative and involves a high degree of risk. There is no secondary market for the investor’s interests and none is expected to develop and there may be restrictions on transferring interests. The Investment Advisor has total trading authority. Performance results are net of fees and expenses and reflect the reinvestment of dividends, interest and other earnings.


Prior performance is not necessarily indicative of future results. Any investment in a fund involves the risk of loss. Performance can be volatile and an investor could lose all or a substantial portion of his or her investment.


The information presented herein is current only as of the particular dates specified for such information and is subject to change in future periods without notice.

By Kieran Brennan July 20, 2026
Dear Partners and Friends, PERFORMANCE Equinox Partners, L.P. declined (-12.4%) net of fees in the second quarter of 2026, finishing the first half of the year up +15.8%. During the second quarter, the S&P 500 index appreciated +15.2% and is up +10.2% through the first half of the year. Equinox’s poor performance for the quarter was driven by declines in both our mining and energy equities. Corporate Governance Corporate governance analysis is central to our research process. We view our long-term investments in publicly traded companies as partnerships with a company’s board of directors. Accordingly, we don't just want to know what decisions a board is making; we know why a board is making decisions. In our opinion, understanding a board’s motivation is the best way to gain durable insight into their corporate strategy and capital allocation policy. Our emphasis on corporate governance has helped us avoid value traps and understand our portfolio companies better. Active engagement is more than informed proxy voting. Active engagement entails a sincere dialogue with directors. While the relationships required for an honest back and forth are not easy to achieve, conversations with directors have become a real differentiator for our research process. Our corporate governance successes have added meaningful value, and our corporate governance failures have taught us important lessons. While each governance situation is unique, we face several recurring problems of note: Non-aligned directors: A surprising number of public company directors own little to no stock. These non-aligned directors fall into two categories: directors who lack sufficient wealth to own a meaningful amount of stock, and wealthy directors who choose not to own shares of the company that they govern. Both situations are problematic. Excessive executive option issuance: Ironically, the largest option grants tend to go to entrenched insiders that don’t need a payment to stay. As the interests of insiders and shareholders are clearly opposed in these cases, it is important that shareholders aggressively oppose excessive option issuance. Bundled voting: The sole purpose of bundling director elections is to reduce shareholder influence. The practice is gaining traction in Brazil, and we are actively opposing the trend. Stakeholder Capitalism: A theory typically used by boards to advance liberal environmental and social agendas that are at odds with shareholder interests. The resulting extreme ESG commitments can be both costly and morally objectionable. Poison Pill Adoption: While there are valid reasons to adopt a poison pill, most of the time they are used to further entrench management and boards and should be opposed by shareholders. Change of control payouts: An egregious practice of paying insiders an additional bonus to sell the company. Such payments are indefensible and the wrong way to address the problem of entrenched insiders. Corporate governance engagement is an art that goes well beyond the application of a set of rules. We don’t vote against every flawed director or proposal. Instead, we seek to explain to board members why we oppose certain practices and expect a good faith effort from them to address our concerns. We aim for improvements, not perfection. OPEC's Last Stand The Equinox Partners upstream oil investments are great at $80 oil, good at $70 oil and reasonable at $60 oil. The 40% portfolio weighting in oil equities reflects our conviction that oil prices will be closer to $80 than $60. Our view incorporates the natural oil supply-demand balance as well as our confidence that this supply demand balance is not solely determined by market forces. Chief amongst those non-market forces is OPEC, an organization that we believe will fight to stay relevant. OPEC’s operating premise is that small changes in oil supply drive much larger changes in the oil price. Therefore, oil exporting countries should modestly restrict oil supply to maximize their revenues. China and America’s active management of the oil market in recent years poses a serious challenge to OPEC’s influence. Having successfully suppressed the oil price with a series of market interventions, America and China have no intention of retreating to a passive approach and hoping for the best. OPEC now faces a stark choice: prevent America and China from rebuilding their oil inventories or become irrelevant. Coordinated interventions intended to manage down the price of oil are nothing new. Oil importing countries launched the International Energy Agency (IEA) in 1974 to do exactly this in the wake of the 1972-1973 Arab oil embargo. Since then, the IEA has formally coordinated oil importing countries’ response to oil market disruptions and OPEC’s oil price manipulation. IEA members, like OPEC members, make certain commitments. Specifically, IEA member countries must maintain 90 days of oil inventory and have a demand restraint program capable of reducing national oil consumption by up to 10%. These commitments enable the IEA to coordinate inventory releases and suppress demand during a crisis such as an oil embargo or war in the Persian Gulf. Absent a crisis, the IEA relies on soft power to contain oil prices. The organization promotes oil alternatives, warns about climate change, and makes pessimistic projections about future oil demand. The IEA has not, however, coordinated direct oil price suppression as a regular course of business. During his first term, Trump followed the historic norms for IEA member countries. When he wanted the oil price down in 2018, he turned to OPEC, not the IEA. Trump famously telephoned Saudi’s crown prince, MBS, asking him to produce more oil. We don’t know exactly what concessions Saudi’s crown prince secured in exchange for the additional oil supply but, presumably, Saudi assistance came at some cost. The Biden administration, perhaps because of its poor relationship with Saudi Arabia, took a more aggressive approach to the oil market, and released 50 million barrels from America’s Strategic Petroleum Reserve in 2021. Biden didn’t seek Congressional authorization for this release, claiming he was just swapping current barrels for future ones. A sleight of hand for sure, but one that recognized America’s new status as a net oil exporter. After Russia invaded Ukraine, Biden was free to take additional measures. He declared an emergency and released an additional 180 million barrels from America’s Strategic Petroleum Reserve, promising to eventually replenish the oil stockpiles he sold, which he only partially did. Once Biden proved that oil price could be influenced through active inventory management, his strategy was certain to be copied. The Iran war offered America and China an opportunity to do exactly that. The US and China have released hundreds of millions of barrels of oil and refined product into the market since the start of the war with Iran. Beyond inventory sales, Trump has constantly talked down the oil price, promised a plunge in oil prices when the war ends, and encouraged additional oil production from Venezuela. The Chinese have taken even bolder action, cutting their domestic demand by millions of barrels a day. While it is impossible to know how much of the Chinese demand reduction is actual demand suppression and how much of it is Chinese inventory sales, the estimated 3-5 million barrel a day decrease in Chinese oil demand since the Iran war started has helped keep a lid on oil prices. While there is no formal coordination between the US and China, the shared interest is clear. Both countries are highly indebted and want low oil prices to contain inflation expectations and domestic interest rates. Combined, the US and China have $45 trillion in federal government debt and another $80+ trillion in private sector debt. A little oil price manipulation probably seems like a small price to pay for the lower financing cost of debt. Low oil prices also serve America and China’s geopolitical interest vis-a-vis Russia. From the US perspective, low oil prices make Russia more likely to do a deal in Ukraine. From the Chinese perspective, low oil prices make Russia more dependent on China. In both cases, American and China clearly believe their geopolitical interests are served by lower oil prices. OPEC has long worried that large oil inventories in oil importing countries could be used to blunt OPEC’s influence over the oil price. America and China’s actions confirm that fear. OPEC is losing members, losing power, and now has a very difficult task ahead: if OPEC wants to stay relevant, OPEC must prevent America and China from restocking their inventories when the straits of Hormuz reopen. This will require carefully managed OPEC oil production and tough conversations with China and America. If OPEC succeeds in reasserting their position in the oil market, the oil market won’t get the full benefit of short-term oil restocking in the US and China. But, longer-term, OPEC’s relevance should ensure oil prices of at least $80. If, on the other hand, OPEC doesn’t reassert itself, China and America will restock their oil inventories quickly, which is short-term oil bullish. Then, China and America will use their excess oil inventories to manage down the oil price, which is long-term bearish.
By Kieran Brennan July 15, 2026
Dear Partners and Friends, PERFORMANCE Kuroto Fund was up +3.5%, net of all fees, in the second quarter of 2026, and finished the first half of 2026 up +32.0%. By comparison, the MSCI Emerging Markets Index returned +24.2% in the quarter and finished up +24.0% for the first half of the year. The MSCI Frontier Markets Index was up +11.2% in the second quarter and up +10.2% for the first half of 2026. Performance in the second quarter was led by strong returns of Guaranty Trust, MTN Ghana, and UAC Nigeria, the last of which we will discuss in greater detail in this letter. These significant gains in our largest African equity holdings were partially offset by the pullback in several of our energy sector holdings. Our portfolio also suffered from the continued sell-off in the Brazilian equity market. We are using this weakness as an opportunity to deploy capital countercyclically into a handful of world-class businesses. Revisiting UAC Nigeria We recently returned from a trip to Nigeria and Ghana where we visited the management teams of several of Kuroto Fund’s long-term investments. One of those investments, United Africa Company of Nigeria (UACN), has appreciated significantly, entering the top 5 by position size for the first time. Given the meaningful contribution to return and large position size, we thought it would be timely to review the investment and learnings from our latest site visit. In the 1920s and 1930s, Lever Brothers Limited established the United Africa Company to facilitate trade in the region, mainly supplying palm oil for their soap operations. In 1974, the Nigerian subsidiary UACN became one of the first publicly listed stocks in the country. Today, it is one of the premier Nigerian companies with an iconic headquarters in Lagos. In the 1990s, Lever Brothers Limited, now known as Unilever, fully exited its shares and UACN diversified into several unrelated businesses, including property development, snack foods (sausage rolls and ice cream), paint, animal feeds, restaurants, and logistics.
By Kieran Brennan April 29, 2026
Dear Partners and Friends, PERFORMANCE Kuroto Fund was up +27%, net of all fees, in the first quarter of 2026. By comparison, the MSCI Emerging Markets index returned 0%, and the MSCI Frontier Markets index was down -1%. Kuroto’s strong performance was principally driven by our oil-producing companies, which were up +78% in the quarter. Our Ghanaian and Nigerian non-resource investments were also up +48% and +18% respectively. EXITING GEORGIA CAPITAL In the first quarter, we sold the last of our Georgia Capital, exiting a successful long-term investment. Since we received Georgia Capital shares, which were spun out of the Bank of Georgia in 2018 at roughly £10 per share, the price has appreciated +260%. In the years immediately following its spinout from the Bank of Georgia, Georgia Capital struggled. The company took on too much debt as they expanded in multiple industries simultaneously. This aggressive behavior stressed the balance sheet and the stock traded at as much as a 50% discount to the “sum of the parts” Net Asset Value (NAV). To their credit, Georgia Capital’s management team realized their mistake and subsequently vowed to exit capital-heavy businesses while spending all available free cash flow (FCF) to pay down debt and buy back stock so long as the company’s shares traded at a meaningful discount to NAV. The execution of this plan combined with double digit organic growth at the underlying businesses allowed the company to compound NAV per share at over 20% for many years. From its peak share count, the company bought back 33% of its shares outstanding at an average price of roughly half of today’s stock price. As the buybacks continued year after year, the market eventually caught on to the value that was being created through this financial arbitrage, and the discount to NAV has gradually shrunk. Absent the excessive holding company discount, the case for management to continue to allocate excess free cash to share buybacks becomes less compelling. We believe management will start to include acquisitions in their capital allocation decisions, which fundamentally changes our investment case. The underlying Georgia Capital portfolio should continue to grow double digits, but we are finding better risk-adjusted return opportunities elsewhere. While we are pleased with the return, we will miss the uncorrelated returns that Georgia Capital provided. Additionally, we will miss the straightforward capital allocation policy adopted by the company’s founder and CEO, Irakli Gilauri. He pursued a disciplined strategy that few CEOs are willing to embrace. We think the market will reward him with a lower cost of capital in the years to come given the discipline he showed buying back the stock when the discount to NAV was larger. We were also very impressed with the talent he recruited to run his portfolio companies. The performance at several of them have turned around recently after initially struggling, and the Bank of Georgia especially has clearly displaced TBC as the best bank in Georgia. THE IMPACT OF HIGHER OIL PRICES The Kuroto Fund portfolio has been and always will be a collection of great businesses. That is, after all, why we chose the name Kuroto , which means connoisseur in Japanese. Our fund’s name is intended to emphasize our appreciation for the characteristics that make our companies exceptional. Owning great businesses does not mean that we ignore macro factors. We have an active view of the macro paths of the countries in which our companies operate, and of the commodities that some of our exceptional companies produce. As we developed an increasingly constructive view on the long-term oil price, we shaped the portfolio to be resilient in a higher oil price environment, while still focusing our investment process on company-specific research and valuation. To help distill the impact of higher oil prices on the Kuroto portfolio, it is useful to segment our portfolio into the following five groups: 1. Ghanaian equities 2. Nigerian equities 3. Brazilian equities 4. Central Asian equities 5. Oil-producing company equities Given our macro analysis on oil prices, it is no coincidence that four of these five segments benefit from higher oil prices. With respect to our upstream oil companies, the connection is obvious. Our non-resource companies in Nigeria, Brazil, and Kazakhstan are also clear beneficiaries as all three countries are meaningful net exporters of crude oil. Higher oil prices improve the government budgets and current accounts in these countries. This leads to additional fiscal stimulus and strengthens the local currencies, both of which are good for our consumer-oriented businesses in these countries. For our investments in Ghana, the impact of higher oil prices is more complicated. Ghana is resource-rich, but it is still an oil importer and higher oil prices are a negative for the country. Thus far, higher gold and cocoa bean prices have more than offset the impact of high oil prices. Given the nuanced commodity picture, we expect the reforms undertaken by Ghana’s Mahama administration to be more decisive than the oil price. For example, debt to GDP has now fallen to 50% as the country continues to deliver on its IMF program. In contrast to the majority of our Kuroto portfolio (and as evidenced by our significant outperformance in Q1), most of the Emerging and Frontier indices are negatively impacted by high oil prices. The top four countries in the MSCI Emerging Markets index, namely China, Taiwan, India, and South Korea – which combined make up over 75% of the index, are all major oil importers. In fact, only about 15% of the index is made up of net oil exporting countries. The situation for the MSCI Frontier Markets index is similar as the index is dominated by oil importers including Vietnam, Morocco, Romania, Slovenia, Kenya and Bangladesh. Only approximately 15% of the index is in companies from net oil exporting countries. Sincerely, Sean Fieler & Brad Virbitsky
By Kieran Brennan April 29, 2026
Dear Partners and Friends, PERFORMANCE Equinox Partners Precious Metals Fund, L.P. rose +7.4% in the first quarter of 2026. Over the same period the price of gold rose +8% and the MVIS Junior Gold Mining Index rose +3.3%. Our portfolio of producing miners led the performance in the quarter returning +12%, while the earlier-stage, pre-production mining portfolio finished the quarter up +4%. THE COMING GOLD MINING M&A CYCLE With gold trading at $4,800 per ounce, the 28 largest Western gold miners are generating an enormous amount of cash. By our calculation, the 28 gold miners listed below will generate close to $60 billion of free cash flow in 2026. After dividends and buybacks, nearly $47 billion of that $60 billion will wind up on these companies’ balance sheets.
By Kieran Brennan April 29, 2026
Dear Partners and Friends, PERFORMANCE Equinox Partners, L.P. rose +32.1% net of fees in the first quarter of 2026 while the S&P 500 index declined -4.3%. Equinox’s performance was primarily driven by the strength of our energy equity portfolio, but we also enjoyed positive contributions from our gold miners, non-resource companies in Emerging & Frontier markets and equity shorts. TODAY’S FRAUGHT INVESTMENT LANDSCAPE The 2020s have been an exceptional decade for Equinox Partners thus far. Our oil and gas companies, gold mining investments and emerging markets businesses have all performed well. As a result, our fund is up 530% since January 1, 2020. Despite this strong performance, our portfolio remains noticeably undervalued. Our nine producing gold miners have a weighted average IRR of 22% at spot gold prices. Our pre-revenue gold companies trade at just $122 per reserve ounce. Our E&P companies generate a 19% free cash flow yield in 2028 at $80 oil, and our non-resource companies trade at 7.8x 2026 earnings. While we are confident in our specific investments, we believe that the overall investment environment is becoming more challenging. The euphoric mood in the stock market strikes us as ominous given the seriously negative geopolitical and economic developments. To be prepared to take advantage of increasingly likely market dislocations, we have increased our liquidity and meaningfully reduced our net equity exposure from 123% in January 2023 to 92% at the end of Q1 2026. The likely developments that are not being properly discounted by the stock or bond markets are as follows: 1. Wars in Iran and Ukraine remain unresolved 2. Democrats retake the House and launch a two-year investigation of the Trump administration 3. Inflation heads higher, not lower 4. Private credit losses kick off a credit cycle 5. U.S. fiscal deficits head higher, not lower THE COMING GOLD MINING M&A CYCLE With gold trading at $4,800 per ounce, the 28 largest Western gold miners are generating an enormous amount of cash. By our calculation, the 28 gold miners listed below will generate close to $60 billion of free cash flow in 2026. After dividends and buybacks, nearly $47 billion of that $60 billion will wind up on these companies’ balance sheets. 
By Kieran Brennan February 3, 2026
Dear Partners and Friends, PERFORMANCE Equinox Partners Precious Metals Fund, L.P. rose +18.8% in the fourth quarter, finishing 2025 up +126.1% net of all fees. By comparison, the Junior Gold Mining Index GDXJ rose +18.9% in the quarter and finished the year up +176.5%. Our portfolio of producing mining companies led the returns for the quarter, in particular our companies that had silver exposure as well as our largest producer, Solidcore Resources. The spot gold price rose +12% in the quarter and finished the year up +64%. At the beginning of 2025, spot gold traded just north of $2,600 an ounce, and by the close of the year traded above $4,300 an ounce. The letter that follows discusses one of the key drivers of gold’s strong rally in 2025 and then delves into a thesis review for the fund’s largest positions at year-end. Trump's War on the Status quo It is no coincidence that our strong performance in 2025 corresponded with the first year of President Trump’s second term. Trump’s frontal assault on the international rules-based order ended decades of coordination between America and Europe, thereby liberating gold and silver from organized government price suppression. Looking ahead to the remainder of Trump’s second term, we expect additional long-dormant market forces to be unleashed as the Western coalition that maintained the post-war economic system breaks down. We also expect America’s unilateral market interventions (such as the current effort to suppress the oil price) to be less successful than the coordinated interventions that characterized the post-World War II era. The uninterrupted rise in the gold price last year was in large part due to deteriorating relations between the US and Europe. In a break with eighty years of history, at no point did any Western government so much as feign interest in the gold price rally. Neither France, nor Italy, nor the IMF threatened to sell any of their substantial gold reserves. Instead, the gold price suppression scheme run by Western governments for decades simply vanished. We don’t know if the Trump administration formally decided to abandon America’s policy of gold price management or if the fraught relationship between Europe and the US simply made continued coordination in the gold market impossible. Perhaps Western governments collectively concluded that a gold price suppression scheme had become untenable given the growing list of government gold buyers. Regardless of the cause, the Western government policy of gold price suppression appears to be over. In a related break with the status quo, Western governments and their financial institutions also stopped managing the silver market. We sense that silver price suppression was never an end in and of itself. Rather, controlling the price of silver was necessary to credibly control the price of gold given the close correlation between the two metals. Accordingly, if the gold market isn’t managed, then neither does the silver market need to be. While America’s next president may pursue a different policy posture towards Europe, America’s relationship with Europe is forever altered. This change will eventually be reflected institutionally and geopolitically, but its effect can already be seen in the markets. The rising gold price is just one of the first signs of this change. While America’s break up with Europe will at times be unsettling, we expect the resulting changes to be positive for our precious metals companies. Investment Thesis Review for our Top 5 Positions by Weight Thesis Gold: 10.2% Portfolio Weight Thesis steadily advanced its Lawyers-Ranch project in British Columbia in 2025. Most notably, in December the company formally initiated the provincial and federal Environmental Assessment process, which starts the permitting clock. Typically, the permitting process would take 3 years, but the government of British Columbia has indicated they would like to complete this sooner. Thesis Gold shares’ outperformance, up 325%, reflects not only their permitting progress, but also the growing possibility of a bidding war for the company. In May 2025, Centerra Gold took a 9.9% stake in Thesis. Given Centerra’s strong financial position (net cash balance sheet and substantial annual free cash flow) and the proximity of their Kemess project to Lawyers-Ranch, they are a likely bidder when their lockup expires in May of this year. That said, we believe with Lawyers-Ranch’s attractive size and location profile, the project should eventually attract offers from multiple intermediate producers. Furthermore, with revaluation of the silver price, the project’s silver content has become increasingly valuable. At strip prices, over 30% of the project’s revenue would be attributable to silver. While Lawyers-Ranch won’t attract the premium of a pure-silver asset, the high silver weighting makes it appropriate for silver companies, thereby increasing the upside multiple. Thesis is not dependent upon a bid to develop their project. They are fully financed through the expected completion of their Feasibility Study in 2027 and could easily finance the entire mine construction capex by selling a silver royalty. Once in production, Thesis should produce 200,000 ounces of gold equivalent per year for 15 years. With a $550 million market cap, we calculate this investment to be a 30%+ IRR assuming flat metals prices. Solidcore Resources: 9.8% Portfolio Weight In 2025, Solidcore made significant progress towards cutting its remaining ties to Russia. Notably, they bought back all the shares held in Russian depository and meaningfully advanced the construction of their new Kazakhstan-based POX plant. With the completion of the Russian share buyback on December 19th, 2025, Solidcore ended a multi-year standoff with Euroclear and created a path to reinstating their dividend. With respect to the POX plant, Solidcore successfully transported their new 1,100-ton autoclave manufactured in Belgium to site in Ertis, Kazakhstan, which was a year-long, technically demanding logistics operation. It required night-time transportation, reinforced roads, and careful coordination to avoid disrupting city life. With the autoclave now in place, the project has begun to ramp full-scale POX construction. We believe the new POX plant could be up and running by year-end 2027, at which point we would expect Solidcore to re-list their stock on the London Stock Exchange. CEO Vitaly Nesis is working to put in place a world-class board and, along with an LSE-listing, recapture the premium valuation that Polymetal garnered prior to the Russian invasion of Ukraine. It is not often that a CEO gets to build the same company twice, but we think that will be the case for Vitaly Nesis and Solidcore. The scale of the revaluation opportunity for Solidcore remains mouthwatering. With a current market cap of $3.5 billion, net cash of $1 billion, and annual free cash flow of $1 billion, Solidcore trades at a 2.5x Enterprise Value to FCF (EV/FCF) multiple. Similarly sized peers typically trade at a 10x EV/FCF multiple or more. We think the dividend will be an initial catalyst for revaluation, and the ultimate revaluation will occur when the equity re-lists on the LSE. Troilus Mining: 7.8% Portfolio Weight Troilus changed their narrative from "if they" to "when they” go into construction by securing $700 million in project financing in March 2025, which they later upsized to a $1 billion package in November. The $1 billion debt financing covers more than 70% of the project’s $1.3 billion capex. Last December, Troilus raised an additional $175 million of equity, and we expect the $125 million balance of construction cost will be easily financed by selling a royalty on the mine’s by-product metals, such as silver. On the regulatory and permitting front, in June, the company submitted their Environmental and Social Impact Assessment (ESIA) to the Government of Canada and Government of Quebec. Importantly, government officials have identified the Troilus project as one of the country’s 10 key natural resource developments of interest. Mark Carney even traveled to Berlin with Troilus to sign their offtake agreement, removing any doubt about government support for the project. This de-risking, both operationally and financially, has positioned Troilus as one of a select few large-scale projects advancing towards construction in Canada. When in production, the Troilus mine will produce an average of 303,000 ounces annually for 22 years at an estimated All-In Sustaining Cost of $1,450 per ounce. When the gold price was $2,000, Troilus was a marginal project in a good jurisdiction. Now with gold trading north of $5,000, Troilus is a high return project in a good jurisdiction. Troilus shares re-rated aggressively in 2025, but the company still only trades at a market capitalization of $650 million, more than a 70% discount to the project’s Net Present Value (using a 5% discount rate and spot metals prices). The mine will be the 5th largest gold mine in Canada, and we anticipate that several large mining companies will have a close look at the project before Troilus makes a final investment decision in December 2026. Hochschild Mining: 7.5% Portfolio Weight Hochschild overcame early operational headwinds at their new Mara Rosa mine in Brazil to finish the year with significant momentum. Despite a summer production warning and subsequent leadership transition at the COO level, the company met its revised annual guidance of over 300,000 gold equivalent ounces. Hochschild's portfolio is anchored by the high-margin Inmaculada mine in Peru which produced 5.6 million ounces of silver last year. Because of Inmaculada, ~40% of Hochschild's revenue is derived from silver at today’s spot prices. Such a high level of silver exposure is unusual and should result in a premium valuation. With a $4.8 billion market cap with no net debt and over $550 million of expected free cash flow in 2026, Hochschild’s valuation reflects no such premium. Hochschild’s new COO Cassio Diedrich (formerly Global Head of Mining for Base Metals at Vale) brings the specific regional and technical expertise required to optimize the growing Brazilian portfolio. Furthermore, the addition of a Brazil Country Manager with a pedigree from Lundin Mining and Yamana Gold significantly de-risks the execution of the Monte do Carmo build. If Hochschild executes on their growth plan, the company could generate over $1 billion in annual free cash flow by 2028. They are now in a strong financial position to fund both growth capex and a meaningful dividend internally from free cash flow. West African Resources: 7.2% Portfolio Weight In 2025, West African Resources (WAF) brought their new Kiaka mine into production on time and on budget. Now with two large, low cost and long-lived mines, WAF is the largest and most profitable gold producer in Burkina Faso. We expect WAF to produce more than 470,000 oz per year through 2040. Unfortunately, the company’s success has not gone unnoticed in cash-strapped Burkina Faso. In September, the government of Burkina Faso expressed their interest in acquiring an additional 35% of the newly completed Kiaka mine as was allowed by the country’s 2022 mining code. As the government does not have the cash to pay for an additional 35%, and the request appears to be an extra-legal attempt to increase the government’s free carry. The uncertainty caused by the government’s effort to up their stake in the Kiaka mine created a cascade of problems for WAF. Most importantly, their shares were suspended on the Australian stock exchange while the uncertainty was sorted out. While the government of Burkina Faso seems to have lost its enthusiasm for a transaction, WAF still must deal with the overhang and optics of the approach. The result is a particularly cheap stock reflecting the political uncertainty of operating in Burkina Faso. WAF has an equity market cap of $2.5 billion and will generate close to $1 billion in annual free cash flow. This exceptionally low valuation comes despite the long-lived and low-cost high-quality assets the company has put into production. The more recent Kiaka mine has a planned life until 2043 and the Sanbrado mine, which started production in 2020, has a modelled life through 2034 that will likely be extended by several years. The aggregate life of mine All-In Sustaining Costs (AISC) for WAF’s projects are just under $1,700 per ounce, putting WAF into the better half of the global gold mining cost curve. We expect the uncertainty around the operating environment in Burkina Faso to clarify over the course of 2026 and 2027. The government, at every level, now understands that it receives the majority of the economics of WAF’s gold mines operated in Burkina Faso. Additionally, with gold mining as the chief economic engine for the country, the government’s interests are best served in both the short and long run by encouraging gold mining and extracting their majority share of the economics. Negotiating for more of the economics simply makes it impossible to attract companies to make incremental investments in the country.
By Kieran Brennan January 28, 2026
Dear Partners and Friends, PERFORMANCE K uroto Fund, L.P. appreciated +8.5% in the fourth quarter and finished the year up +64.9%. By comparison, the broad MSCI Emerging Markets Index rose +4.8% in the quarter, finishing the year up +34.4%. The positive contributors to Kuroto’s performance were broad-based, with 11 stocks contributing over $1 million of gains for the year and only 2 positions detracting more than $1 million. The biggest contributors to the performance were MTN Ghana, our Nigerian stocks, and Georgia Capital. The biggest detractors were Kosmos Energy and Gran Tierra. Looking at our portfolio today, we are surprised at how attractive it still looks given our performance last year. Our portfolio’s price to earnings ratio is 5.9x for 2026, with a dividend yield of 6%, generating an ROE of 28%. While these are imperfect metrics, they don’t show a portfolio that’s expensive. We take a more nuanced look at the valuation of our top five positions below, which represent 61% of the portfolio today. Moreover, we are still finding attractive incremental investment opportunities. In this regard, Brazil stands out as a particularly attractive incremental market for us. With policy rates at 15%, local investors are happy to hold fixed income securities which has kept equity valuations depressed. As concerns about US economic policy grow, risk capital should flow to emerging and frontier markets. US equities account for 47% of total equity value globally. Brazil, by contrast, accounts for just 0.6% of global equity value. Needless to say, a small shift from US equity markets to EM markets could result in a meaningful upward revaluation of emerging market stock markets such as Brazil’s. A breakdown of Kuroto Fund exposures can be found here . Investment Thesis Review for the Top Five Positions by Portfolio Weight MTN Ghana: 20.5% Portfolio Weight MTN Ghana continues to be our largest investment. Through the first nine months of 2025 (full year results are not yet released), the company’s revenue grew 36.2% and earnings were up 45.9%. It generated a ROE of over 50% and is on track to pay out 80% of earnings in dividends. The company continues to dominate the voice and data telecom services market, as well as money transfer and digital payments in the country. The biggest growth driver of the business has been data. Our understanding is that latent demand for data is such that any investment MTN Ghana makes into its telecom infrastructure is immediately utilized. MTN has not been under-investing in infrastructure, but its competitors have been. The second largest competitor was Vodacom, but they sold out to Telecel in 2023. Since purchasing Vodacom Ghana, Telecel has underinvested in its network and has been losing market share. The third and fourth largest networks, Bharti Airtel and Tigo, merged their operations in 2017 to attempt to compete more effectively, but they did not invest enough to be competitive and ended up selling to the government in 2021 for $1. Since then, the government has absorbed the third player’s operating losses while not investing meaningfully in infrastructure. Currently, the government is considering both selling a stake to remove ongoing losses as well merging its Airtel-Tigo with Telecel to create a stronger competitor to MTN Ghana. Combining two under-invested networks will not fix the problem unless someone commits to spending a meaningful amount of capital to add to and upgrade telecom infrastructure. MTN Ghana has invested over $3 billion to make its network the dominant one in the country. It’s unlikely someone will come forward to write a check big enough to meaningfully alter that dynamic. The second biggest growth driver, and potentially the most valuable piece of the business longer term is the mobile financial services business – MoMo. MTN continues to dominate money transfers and payments in the country with 90%+ market share. In early 2025, the government removed the e-levy tax on money transfer which spurred growth for the year. Now the service mix is shifting to higher value services like merchant payments and savings and lending products and away from pure person-to-person money transfer. The company recently separated its mobile financial services business from its telecom business internally, and going forward will report the financials of these businesses independently. The company is guiding that in 3-5 years they will list the mobile financial services business separately. It’s possible that this leads to a higher valuation for the group at some point, as these sorts of fintech businesses tend to trade at much higher multiples than telecom businesses. In our estimates, we see the stock currently trading at 5.6x our estimate of 2026 earnings, earning a 55% ROE and paying out a 10.7% dividend yield. The company forecasts high-30s% revenue growth in the medium term, stable margins, and a continued 80%+ payout ratio. Georgia Capital: 12.2% Portfolio Weight Georgia Capital had a great year. From December 2024 to the end of Q3 2025, the company’s NAV per share increased 42%. And for the full year 2025, the company is forecasting a 46% increase in FCF per share. The share price outpaced the intrinsic value growth, and the discount to the sum of the parts that the stock trades at has come in from ~50% discount at year end 2024 to a ~25% discount today. There were three big drivers of Georgia Capital’s performance in 2025. The first was the strong performance of its largest holding, Lion Finance Group (formerly known as the Bank of Georgia). Since 2019, when current CEO Archil Gachechiladze took over, Lion Finance Group has transformed from a good bank into a great one. The ROE expectation has increased from low-20s% to high 20s%, Net Promoter Score has increased from mid-30s to mid-70s, and 2025 EPS is forecast to be nearly 5x what it was in 2019. In 2025, the bank continued to perform strongly and is now getting recognized for it in the stock market. Listed in London, it is now a FTSE 100 stock, and having had traded around 1x book value for the past 5 years, is now at closer to 1.5x Price to Book Value. We think the bank will continue to grow revenues at a double-digit percentage, earn a high 20s% ROE, and support a 5%+ dividend yield. As such, we think Lion Finance Group stock still trades at a very reasonable valuation, and are comfortable with it as just over half of Georgia Capital’s NAV. The second big driver for Georgia Capital in 2025 was its aggressive share repurchase program. Since merging with its healthcare subsidiary in August 2020, Georgia Capital has shrunk its share count from 47.9 million shares to 35.4 million at the end of Q3 2025. From Q1 through Q3 this year, they repurchased 10.4% of their beginning of 2025 shares outstanding and continued to buyback through Q4. They funded this aggressive buyback through a combination of operating cash flow, selling down some of the group’s stake in the bank, and disposing of some non-core assets. Repurchasing shares while trading at a substantial discount to NAV is a good recipe for NAV per share growth, and Georgia Capital did a lot of that this year. Now that the discount has closed to a ~25% discount, this is less attractive but still reasonable given that look-through valuation is still only a single digit P/E multiple. The third key 2025 driver for Georgia Capital was the increase in value of the rest of Georgia Capital’s portfolio. The biggest pieces of the group after the bank are its pharmacy business, hospital business, and insurance company. Pharmacy and hospitals saw a 21.1% and 38.7% increase in operating cash flow respectively, and insurance saw a 23% increase in profit before tax. We expect continued double-digit profit growth in the medium term for these businesses, though not 20%+, which was helped by a cyclical margin recovery in 2025. Currently, our look-through P/E multiple for the group is 7x, which is attractive for this combination of businesses that earn good returns on capital and grow earnings double digits. Going forward, we anticipate growth will be driven more by earnings growth and capital returns rather than a decrease in the holding company discount to the sum of the parts. As such, we’ve trimmed the position modestly. Seplat Energy: 12.2% Portfolio Weight Seplat acquired Exxon Mobil’s shallow water operating unit in December 2024, more than doubling the size of its production and reserves. As a result, 2025 was a year of asset integration. Thus far, the company has managed the much larger production base well. Production averaged 135,000 barrels of oil equivalent per day (boepd) in the first three quarters of 2025, up from less than 50,000 boepd prior to the acquisition. Seplat has maintained this level of production throughout the year without drilling any incremental wells into the former Exxon Mobil assets, only reactivating old, previously shut-in wells. In fall of 2025, Seplat unveiled their 5-year plan for the newly combined portfolio. Encouragingly, Seplat was able to keep most of the Exxon Mobil in-country team, many of whom have 20+ years of experience with these assets and were trained to Exxon’s global standards. This makes the five-year plan to grow corporate production from 130,000 boepd to 200,000 boepd look very achievable. Seplat is trading at a high single digit FCF yield at the current low-$60 oil price. Debt to cash flow is less than 1x. They plan to pay out 45% of FCF as dividends while also investing to grow production approximately 9% per year for the next 5 years. Assuming a $65 Brent oil price, Seplat is guiding for a cumulative $2 to $3 billion in FCF over the next 5 years, which compares to their equity market cap of $2.5 billion. By 2030, Seplat should be producing over 200,000 boepd, generating north of $500 million in FCF annually and still have a long growth runway ahead. That said, it is no longer as enormous of an outlier in terms of valuation relative to some other emerging market oil and gas ideas we have, two of which are trading at north of 20% free cash flow yield today or in the next six months. Solidcore Resources: 11.8% Portfolio Weight In 2025, Solidcore made significant progress towards cutting its remaining ties to Russia. Notably, they bought back all the shares held in Russian depository and meaningfully advanced the construction of their new Kazakhstan-based POX plant. With the completion of the Russian share buyback on December 19th, 2025, Solidcore ended a multi-year standoff with Euroclear and created a path to reinstating their dividend. With respect to the POX plant, Solidcore successfully transported their new 1,100-ton autoclave manufactured in Belgium to site in Ertis, Kazakhstan, which was a year-long, technically demanding logistics operation. It required night-time transportation, reinforced roads, and careful coordination to avoid disrupting city life. With the autoclave now in place, the project has begun to ramp full-scale POX construction. We believe the new POX plant could be up and running by year-end 2027, at which point we would expect Solidcore to re-list their stock on the London Stock Exchange. CEO Vitaly Nesis is working to put in place a world-class board and, along with an LSE-listing, recapture the premium valuation that Polymetal garnered prior to the Russian invasion of Ukraine. It is not often that a CEO gets to build the same company twice, but we think that will be the case for Vitaly Nesis and Solidcore. The scale of the revaluation opportunity for Solidcore remains mouthwatering. With a current market cap of $3.5 billion, net cash of $1 billion, and annual free cash flow of $1 billion, Solidcore trades at a 2.5x Enterprise Value to FCF (EV/FCF) multiple. Similarly sized peers typically trade at a 10x EV/FCF multiple or more. We think the dividend will be an initial catalyst for revaluation, and the ultimate revaluation will occur when the equity re-lists on the LSE. Guaranty Trust: 8.9% Portfolio Weight Guaranty Trust performed well in 2025, posting a 31% ROE while growing their loan book by 16%. Earnings per share declined 6% YoY due to the normalization of their foreign currency earnings (rather than any deterioration in the business). After a lost decade under the former President Buhari, Nigeria is now beginning to grow again. GDP grew at 4% in 2025 despite weak oil prices, and government foreign exchange reserves are again healthy. Where inflation ran at 25% a year ago, it dropped to 14.5% as of November 2025. We expect Nigerian interest rates to follow inflation lower, which should spur loan growth. For the first time we can remember, Nigerian businesses are borrowing and investing, the currency has been stable, and the locals we speak to are genuinely optimistic. With a capital ratio of over 40% and a loan-to-deposit ratio of only 27%, Guaranty Trust remains Nigeria’s most conservative bank. With a cost of funding of only 3% and a cost to income ratio of sub-30%, Guaranty Trust doesn’t have to take much credit risk to generate spectacular returns on equity. Not surprisingly, simply owning government bonds is their preferred strategy in the current rate environment. Today, Guaranty Trust trades at 3.3x forward earnings and just less than book value. We expect the company to continue earning at least a high-20s% ROE, which should support both a 10%+ dividend yield and strong loan growth. Sincerely, Sean Fieler & Brad Virbitsky
By Kieran Brennan January 28, 2026
Dear Partners and Friends, PERFORMANCE Equinox Partners, L.P. rose +17.3% net of fees in the fourth quarter, finishing the calendar year 2025 up +80.9%. By comparison, the S&P 500 index rose +2.7% in the fourth quarter and +17.9% for the year. Our precious metal miners accounted for the vast majority of our gains last year. Our relatively small exposure to non-commodity Operating Companies in Frontier & Emerging markets also performed extremely well. Our energy equities declined modestly, and our equity shorts were roughly P&L neutral for the year. Trump's War on the Status Quo It is no coincidence that our strong performance in 2025 corresponded with the first year of President Trump’s second term. Trump’s frontal assault on the international rules-based order ended decades of coordination between America and Europe, thereby liberating gold and silver from organized government price suppression. Looking ahead to the remainder of Trump’s second term, we expect additional long-dormant market forces to be unleashed as the Western coalition that maintained the post-war economic system breaks down. We also expect America’s unilateral market interventions (such as the current effort to suppress the oil price) to be less successful than the coordinated interventions that characterized the post-World War II era. The uninterrupted rise in the gold price last year was in large part due to deteriorating relations between the US and Europe. In a break with eighty years of history, at no point did any Western government so much as feign interest in the gold price rally. Neither France, nor Italy, nor the IMF threatened to sell any of their substantial gold reserves. Instead, the gold price suppression scheme run by Western governments for decades simply vanished. We don’t know if the Trump administration formally decided to abandon America’s policy of gold price management or if the fraught relationship between Europe and the US simply made continued coordination in the gold market impossible. Perhaps Western governments collectively concluded that a gold price suppression scheme had become untenable given the growing list of government gold buyers. Regardless of the cause, the Western government policy of gold price suppression appears to be over. In a related break with the status quo, Western governments and their financial institutions also stopped managing the silver market. We sense that silver price suppression was never an end in and of itself. Rather, controlling the price of silver was necessary to credibly control the price of gold given the close correlation between the two metals. Accordingly, if the gold market isn’t managed, then neither does the silver market need to be. It’s unfortunate that Trump has paired his liberation of gold and silver with the enthusiastic suppression of the oil price. This, too, is a break with the status quo. We are aware that for most of the post-war period, America has worked with a coalition of Western oil consuming countries to ensure the long-term availability of oil at reasonable prices. But Trump’s policy of targeting an uneconomic oil price is unprecedented. Should Trump achieve his stated goal of $50 oil, such a low price will prove unsustainable. With oil averaging $60 over the past year, there has been no increase in US production and non-OPEC supply increases have been muted. Perhaps direct government subsidies can spur a supply increase from Venezuela, but that remains to be seen. Absent new government subsidies, oil production growth will prove a challenge at $60, let alone $50. Harold Hamm, a close Trump confidant, has conveyed this message to Trump. Presumably, Trump realizes his policy of oil price suppression is unsustainable. We certainly do. While America’s next president may pursue a different policy posture towards Europe, America’s relationship with Europe is forever altered. This change will eventually be reflected institutionally and geopolitically, but its effect can already be seen in the markets. The rising gold price is just one of the first signs of this change. While America’s break up with Europe will at times be unsettling, we expect the resulting changes to be positive for our commodity exposures, as well as our deeply discounted companies in Frontier and Emerging markets. Investment Thesis Review for our Top 5 Long Positions By portfolio Weight Solidcore Resources: 11.8% Portfolio Weight In 2025, Solidcore made significant progress towards cutting its remaining ties to Russia. Notably, they bought back all the shares held in Russian depository and meaningfully advanced the construction of their new Kazakhstan-based POX plant. With the completion of the Russian share buyback on December 19th, 2025, Solidcore ended a multi-year standoff with Euroclear and created a path to reinstating their dividend. With respect to the POX plant, Solidcore successfully transported their new 1,100-ton autoclave manufactured in Belgium to site in Ertis, Kazakhstan, which was a year-long, technically demanding logistics operation. It required night-time transportation, reinforced roads, and careful coordination to avoid disrupting city life. With the autoclave now in place, the project has begun to ramp full-scale POX construction. We believe the new POX plant could be up and running by year-end 2027, at which point we would expect Solidcore to re-list their stock on the London Stock Exchange. CEO Vitaly Nesis is working to put in place a world-class board and, along with an LSE-listing, recapture the premium valuation that Polymetal garnered prior to the Russian invasion of Ukraine. It is not often that a CEO gets to build the same company twice, but we think that will be the case for Vitaly Nesis and Solidcore. The scale of the revaluation opportunity for Solidcore remains mouthwatering. With a current market cap of $3.5 billion, net cash of $1 billion, and annual free cash flow of $1 billion, Solidcore trades at a 2.5x Enterprise Value to FCF (EV/FCF) multiple. Similarly sized peers typically trade at a 10x EV/FCF multiple or more. We think the dividend will be an initial catalyst for revaluation, and the ultimate revaluation will occur when the equity re-lists on the LSE. Troilus Mining: 10.9% Portfolio Weight Troilus changed their narrative from "if they" to "when they” go into construction by securing $700 million in project financing in March 2025, which they later upsized to a $1 billion package in November. The $1 billion debt financing covers more than 70% of the project’s $1.3 billion capex. Last December, Troilus raised an additional $175 million of equity, and we expect the $125 million balance of construction cost will be easily financed by selling a royalty on the mine’s by-product metals, such as silver. On the regulatory and permitting front, in June, the company submitted their Environmental and Social Impact Assessment (ESIA) to the Government of Canada and Government of Quebec. Importantly, government officials have identified the Troilus project as one of the country’s 10 key natural resource developments of interest. Mark Carney even traveled to Berlin with Troilus to sign their offtake agreement, removing any doubt about government support for the project. This de-risking, both operationally and financially, has positioned Troilus as one of a select few large-scale projects advancing towards construction in Canada. When in production, the Troilus mine will produce an average of 303,000 ounces annually for 22 years at an estimated All-In Sustaining Cost of $1,450 per ounce. When the gold price was $2,000, Troilus was a marginal project in a good jurisdiction. Now with gold trading north of $5,000, Troilus is a high return project in a good jurisdiction. Troilus shares re-rated aggressively in 2025, but the company still only trades at a market capitalization of $650 million, more than a 70% discount to the project’s Net Present Value (using a 5% discount rate and spot metals prices). The mine will be the 5th largest gold mine in Canada, and we anticipate that several large mining companies will have a close look at the project before Troilus makes a final investment decision in December 2026. Silver Futures: 9.0% Portfolio Weight Despite the more than three-fold increase in the silver price since January 2024, the supply and demand deficit for the metal hasn’t improved much. Beginning with supply, we expect a de minimis year over year increase in mine supply in 2026 and a 30-million-ounce uptick in recycling. Taken together, we forecast total silver supply will increase 4% in 2026. It’s worth noting that an uptick in recycling is likely a one-time phenomenon, and going forward silver supply growth will depend solely on mine supply. On this point, despite the high silver price, we expect very little mine supply growth again in 2027. Sustained increases in silver mine supply require a more permissive permitting regime in countries such as Mexico, Guatemala, Peru and Chile. Even at $100 an ounce, we expect industrial demand for silver to remain basically flat. Silver is used in industrial applications because of the unique attributes of its valence electrons, and there is no good substitute in most cases. Absent government restrictions on silver use, we don’t foresee much of a decline in industrial silver demand. The one area of possible demand destruction is in Indian silverware purchases. Given the inelasticity of both silver supply and demand, we foresee only a modest increase in the metal available for investment to 150 million ounces. (See supply and demand table below) Importantly, a sizable fraction of these 150 million ounces will be consumed by mints producing silver coins. Most incremental investment demand will have to be met by existing owners of metal and the physical silver market will remain tight. We remain bullish, but we’ve trimmed 80% of our silver ounces given the price move.
By Kieran Brennan November 11, 2025
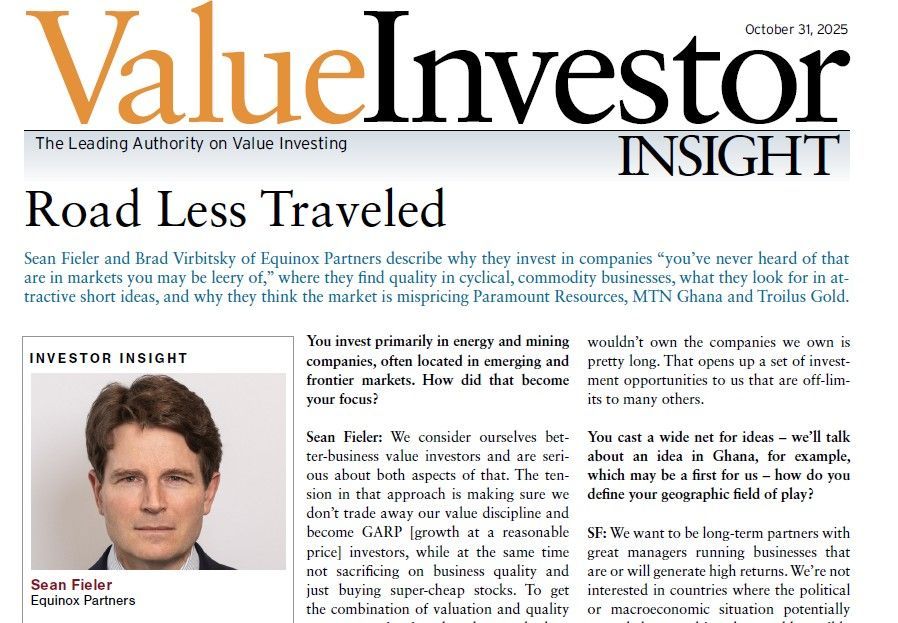
Value Investor Insight Profile with Sean Fieler and Brad Virbitsky
More Posts