Equinox Partners, L.P. - Q2 2016 Letter

Dear Partners and Friends,

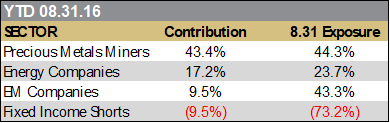
PERFORMANCE & PORTFOLIO

Equinox Partners gained +24.9% in the second quarter of 2016 and we estimate +64.2% for the year to date through September 15.[1] 

The dollar and equinox

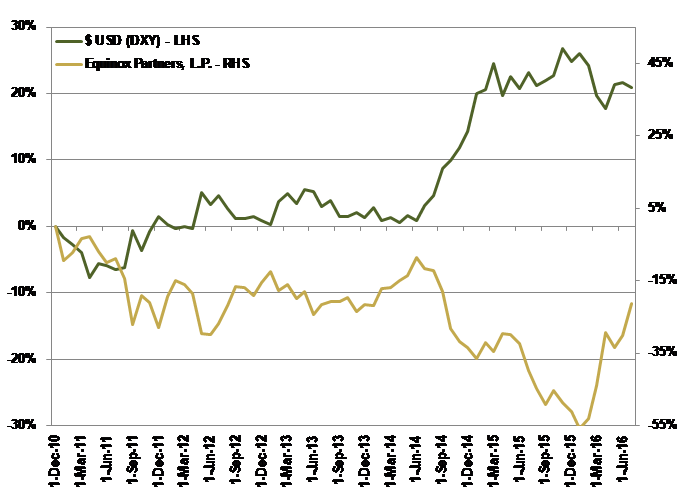
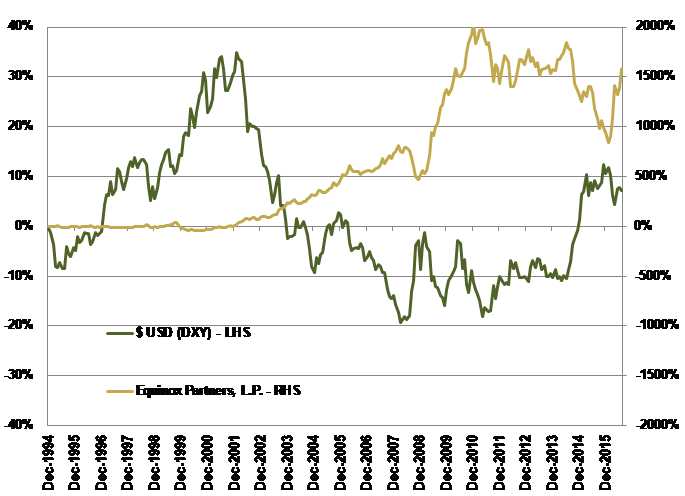
As the adjacent, near-mirror image makes clear, Equinox and the U.S. dollar index (DXY) have been inversely correlated for years. Since January 2011, the monthly correlation is -0.58 (r). But, the graph also shows that the impact of this correlation has been changing. Specifically, the recent sideways drift of the U.S. dollar index bears little resemblance to our fund’s 2015 decline or 2016 appreciation. Rather, these last two years are reminiscent of the pre-2011 period during which investment fundamentals overwhelmed other factors. In the letter that follows, we will detail the nature of our fund’s relationship with the U.S. dollar index, and explain why the U.S. dollar’s value against other developed world currencies is not a reliable guide to our fund’s performance over time

A review of recent instances in which the U.S. dollar index declined or appreciated by 5% or more provides a useful starting point for our analysis. Short-term declines in the U.S. dollar index of 5% or more during 2013, 2015, and 2016 translated into positive performance for our fund of 9.6%, 9.6%, and 31.5% respectively.  Conversely, the sharp 25.8% rally in the U.S. dollar index from June 2014 to March 2015 corresponded to a 28.0% decline in our fund.[2] Moreover, we have every reason to believe that precipitous, short-term moves in the U.S. dollar index will continue to have an inverse short-term effect on our fund.  


This short-term inverse correlation does not, however, provide a reliable indication of our fund’s performance over time. There are two principle reasons for this divergence. First, sharp, short-term moves in the U.S. dollar index tend to cancel each other out over time. Second, and more importantly, the intrinsic value of our companies has compounded over time, while the dollar’s value against other developed world currencies has remained range bound.


Our fund’s muted long-term relationship with the U.S. dollar index becomes obvious when the relationship is graphed over the twenty-two years since our fund’s inception (below). Over this period of time, both our fund and the U.S. dollar index are up. Specifically, over the past twenty-two years, the U.S. dollar index is up +12%, while Equinox is up 15 times. This result strongly suggests that the movement of the U.S. dollar index tells us little about the cumulative performance of our fund in the long term. Rather, over time, the underlying fundamentals of our investments remain the best proxy for performance. 

Of course, to the extent that oil, gas, gold, and silver prices are largely driven by moves in the U.S. dollar index, our focus on fundamentals might appear circular. In this regard, it is worth noting that the aforementioned all fell as the U.S. dollar index declined during 2015, while their results were mixed during the 2013 decline in the U.S. dollar index. Against this backdrop of muddled data, the argument that gold, silver, gas, and oil are all up this year principally because the U.S. dollar index is down, strikes us as a weak argument.

Quite clearly, in the case of oil and gas, supply-demand dynamics have been the principle driver for their positive year-to-date performance. And, the logic of the supply-demand balance has next to nothing to do with the U.S. dollar index. These two commodities, which had been in structural oversupply, are now in closer balance as reflected in the appreciation of their prices and the related E&P equities that we own. This closer balance between supply-demand, not the fall in the U.S. dollar index, best explains the increase in oil and gas prices for the year to date.


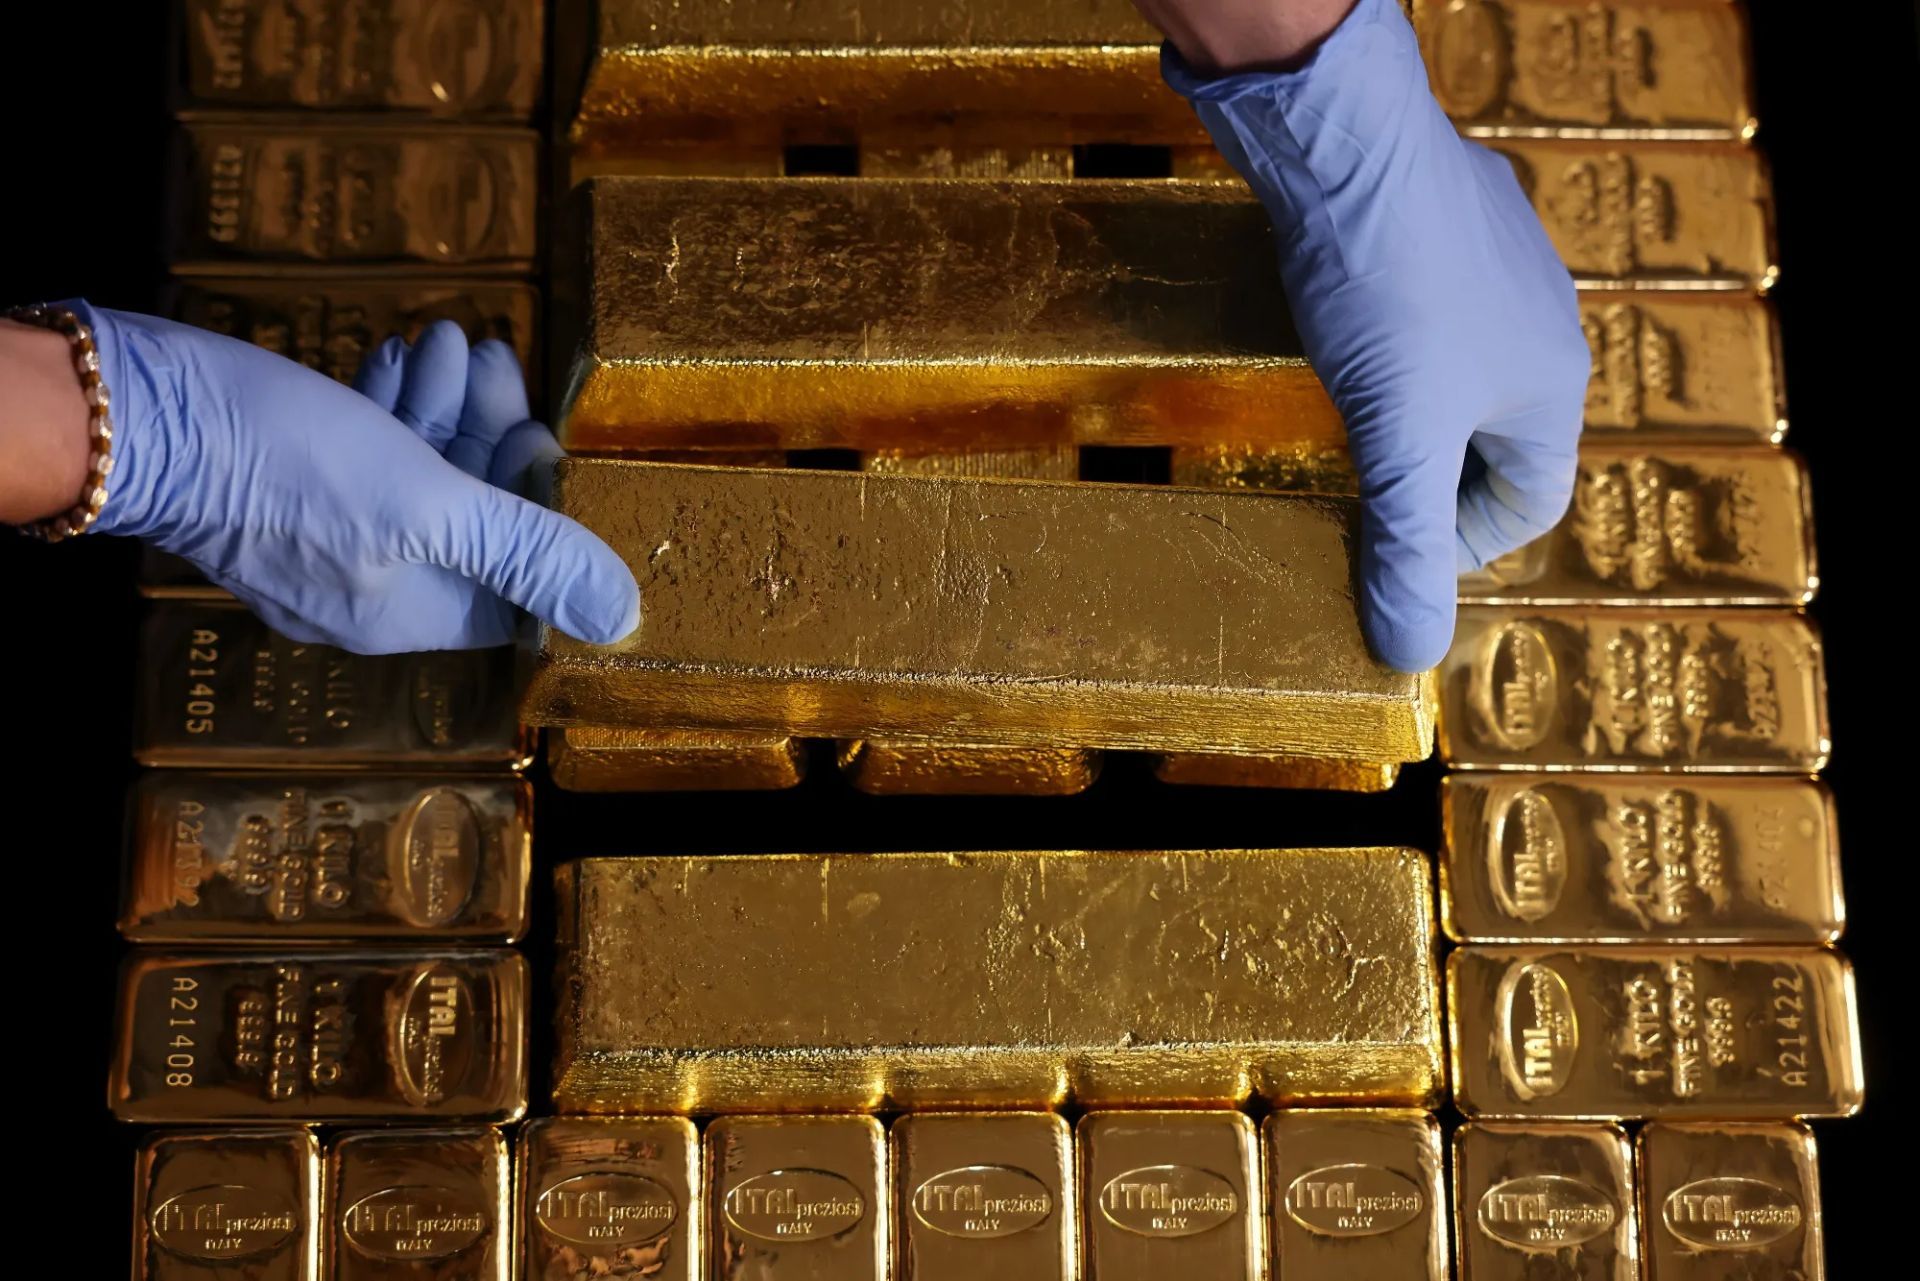
The inverse correlation of the U.S. dollar index with gold and silver is of course more closely related to the fundamentals of these monetary metals. Gold and silver are, after all, U.S. dollar alternatives. But, gold and silver are also monetary alternatives to the euro, yen, and the other developed world currencies that comprise the peer set against which the U.S. dollar is measured in its index. Moreover, since the turn of the twenty-first century, gold and silver have performed well not only against the dollar, but also against all developed world currencies. Accordingly, the dollar’s relative weakness against the euro, yen, British pound, Swiss franc, and Swedish krona, as captured in the U.S. dollar index, is not an explanation of the longer-term appreciation of gold and silver. Rather, the relative appreciation of these monetary metals against developed world currencies is the result of developed world central banks’ collective policy of currency devaluation. So long as the developed world’s central banks are committed to easy money, gold and silver are likely to continue remonetizing.


The correlation between the U.S. dollar index and our fixed income shorts in Japan, Europe, and the U.S. is equally complex. There is, of course, a strong-U.S. dollar index-higher-rate scenario which would be good for our bond shorts, i.e. the U.S. economy improves and the Federal Reserve normalizes rates. But, there is also a weak-U.S. dollar index-weak-bond scenario in which the Fed fails to raise rates sufficiently as inflation picks up. In either of these scenarios, bond fundamentals would deteriorate and we would profit. The more problematic scenario, from our perspective, involves less-pronounced fundamentals providing an unremarkable backdrop against which increased levels of central bank manipulation could drive bond prices higher.


Finally, with respect to the superior emerging markets businesses we own, a weak U.S. dollar index is generally better, but only within limits. With few exceptions, our overseas companies principally conduct business in local currencies. So, a weaker dollar makes their business more valuable in dollar terms while also making emerging market economies less susceptible to capital flight. Should, however, a weak U.S. dollar index reflect a recession in the U.S., it would be a short-term negative for our emerging markets investments regardless of the extent to which our specific companies are fundamentally insulated from the U.S. economy.


It is worth reiterating that we have no strong opinions as to how the U.S. dollar will fair against other developed world currencies. The U.S. dollar/euro and U.S. dollar/yen cross rates, which together account for over 70% of the U.S. dollar index, have become highly politicized, and therefore highly unpredictable. Consequently, we feel no need to take a position or even have an opinion on the dollar/yen or the dollar/euro rate. Instead of taking a position on the relative merits of various developed world currencies, we’ve positioned our fund so as to both avoid and capitalize on the unsustainable cycle of debt and aggressive monetary policy that continues to characterize the entirety of the developed world. 


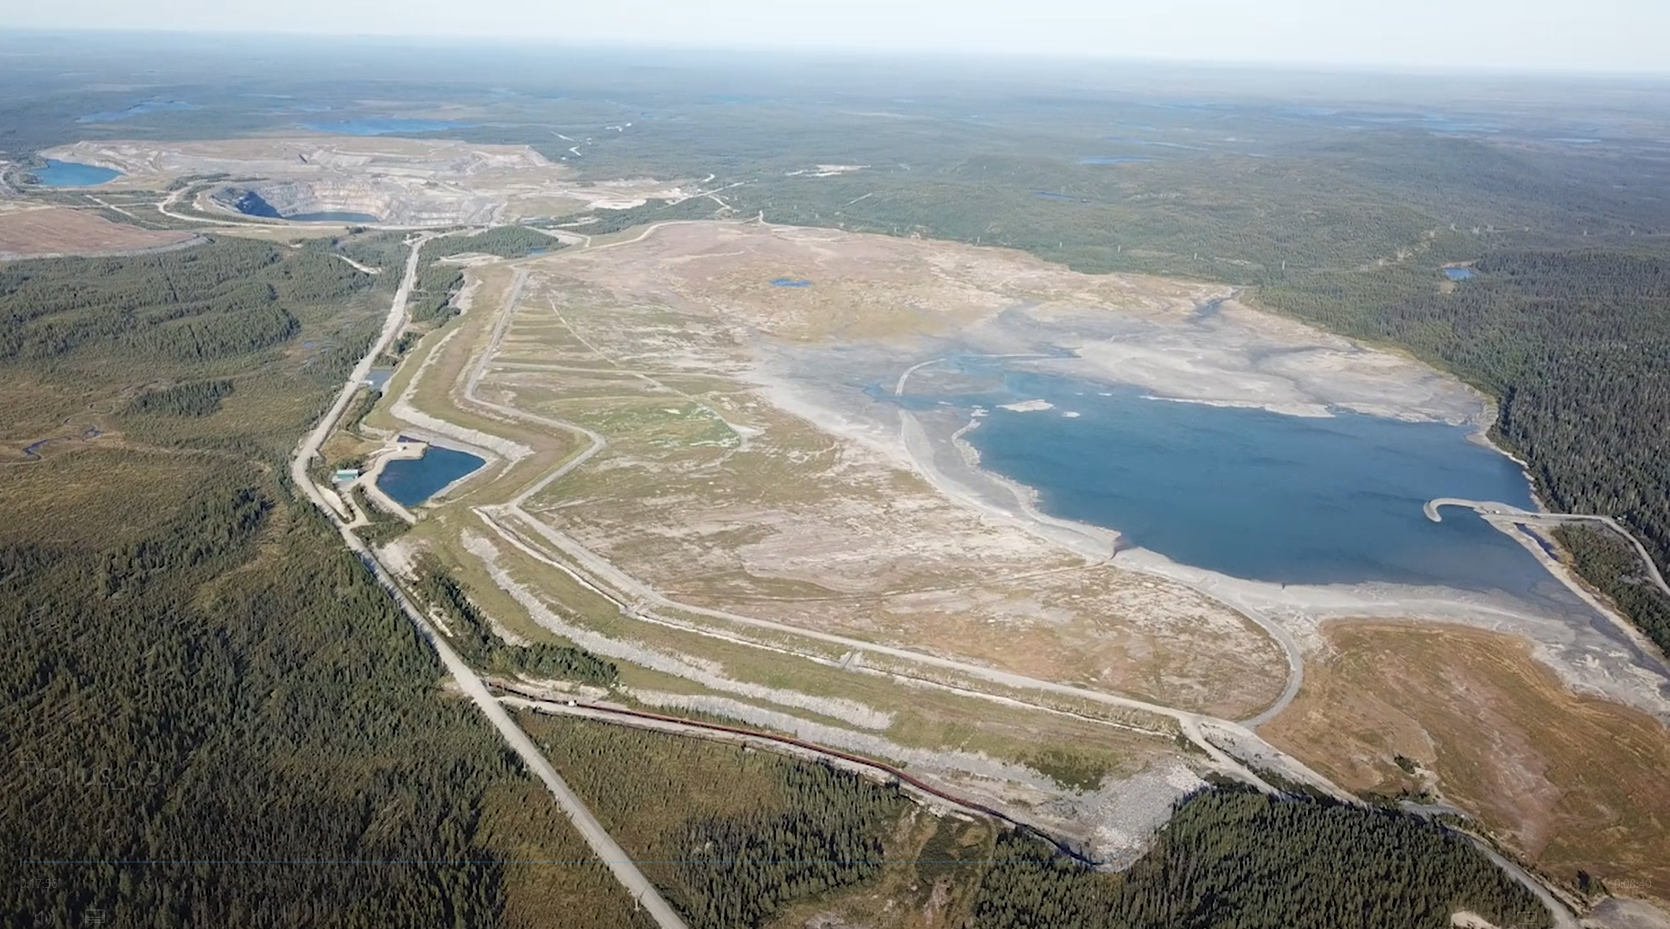
Having positioned ourselves on the right side of financial history, we spend the vast majority of our analytical resources identifying and analyzing specific businesses. We are company-specific value investors operating in extraordinary times. While it is important to avoid a conventional portfolio construction in times like these, it is equally important that we never lose focus on the merits of the specific companies we own. For, only by owning superior, undervalued companies and aligning ourselves with exceptional managements, will we generate superior returns while minimizing permanent losses over the long term. To emphasize the company-specific nature of our work, we conclude with a description of Crew Energy, a top-five position that captures the type of company-specific opportunities that are also aligned with today’s macroeconomic and geopolitical fundamentals.

Crew Energy

Crew Energy, a Calgary-based E&P company exposed to oil and gas pricing in roughly equal proportions, is far superior to a direct investment in oil and gas in our opinion. We believe that at strip pricing (prices which by definition will generate no return for an investor in oil and gas futures) Crew will rapidly grow both its production and cash flow.


At strip prices, we expect Crew to grow production from 22,000 boepd (barrel of oil equivalent per day) to 60,000 bpd in 2019.  In addition to this production growth, we expect Crew to take its operating cost per barrel down from $6 today, to less than $4 over the same time period. As a result, Crew’s cash flow should grow faster than its production. We estimate that Crew will generate around $80m CAD of cash flow this year and more than $325m in 2019.


With a market cap of $900m CAD and an enterprise value of $1.2b CAD, Crew is trading at 7.5x next year’s cash flow—a discount to the average North American E&P company. Needless to say, this discount reflects skepticism about Crew’s ability to achieve its three-year growth and cash flow targets. This skepticism strikes us as misplaced given that Crew has both the land and, with the benefit of asset sales, sufficient internally-generated cash flow to achieve this growth without raising equity. 


This remarkable disconnect between Crew’s value and valuation, can in part be explained by the company’s size and location. But, more generally, the investment opportunity in Crew exists because markets are not efficient. Capturing such compelling company-specific opportunities has been and will remain central to our success.


Sincerely,


Sean Fieler        Daniel Gittes


END NOTES

[1] Performance contribution derived in US dollars, gross of fees and fund expenses. Interest rate swaps notional value and P&L included in Fixed Income. P&L on cash excluded from the table as are market value exposures for derivatives. All company-specific data derived from internal analysis, company presentations, or Bloomberg.


[2] Analysis details daily peak-to-trough gain/loss for the DXY index versus Equinox Partners performance, as calculated over the same periods using gross IRR derived from fund P&L and average, period capital. Graph shows month-end data for both the DXY index and Equinox Partners net returns; axes adjusted to visualize correlations.

By Kieran Brennan February 3, 2026
Dear Partners and Friends, PERFORMANCE Equinox Partners Precious Metals Fund, L.P. rose +18.8% in the fourth quarter, finishing 2025 up +126.1% net of all fees. By comparison, the Junior Gold Mining Index GDXJ rose +18.9% in the quarter and finished the year up +176.5%. Our portfolio of producing mining companies led the returns for the quarter, in particular our companies that had silver exposure as well as our largest producer, Solidcore Resources. The spot gold price rose +12% in the quarter and finished the year up +64%. At the beginning of 2025, spot gold traded just north of $2,600 an ounce, and by the close of the year traded above $4,300 an ounce. The letter that follows discusses one of the key drivers of gold’s strong rally in 2025 and then delves into a thesis review for the fund’s largest positions at year-end. Trump's War on the Status quo It is no coincidence that our strong performance in 2025 corresponded with the first year of President Trump’s second term. Trump’s frontal assault on the international rules-based order ended decades of coordination between America and Europe, thereby liberating gold and silver from organized government price suppression. Looking ahead to the remainder of Trump’s second term, we expect additional long-dormant market forces to be unleashed as the Western coalition that maintained the post-war economic system breaks down. We also expect America’s unilateral market interventions (such as the current effort to suppress the oil price) to be less successful than the coordinated interventions that characterized the post-World War II era. The uninterrupted rise in the gold price last year was in large part due to deteriorating relations between the US and Europe. In a break with eighty years of history, at no point did any Western government so much as feign interest in the gold price rally. Neither France, nor Italy, nor the IMF threatened to sell any of their substantial gold reserves. Instead, the gold price suppression scheme run by Western governments for decades simply vanished. We don’t know if the Trump administration formally decided to abandon America’s policy of gold price management or if the fraught relationship between Europe and the US simply made continued coordination in the gold market impossible. Perhaps Western governments collectively concluded that a gold price suppression scheme had become untenable given the growing list of government gold buyers. Regardless of the cause, the Western government policy of gold price suppression appears to be over. In a related break with the status quo, Western governments and their financial institutions also stopped managing the silver market. We sense that silver price suppression was never an end in and of itself. Rather, controlling the price of silver was necessary to credibly control the price of gold given the close correlation between the two metals. Accordingly, if the gold market isn’t managed, then neither does the silver market need to be. While America’s next president may pursue a different policy posture towards Europe, America’s relationship with Europe is forever altered. This change will eventually be reflected institutionally and geopolitically, but its effect can already be seen in the markets. The rising gold price is just one of the first signs of this change. While America’s break up with Europe will at times be unsettling, we expect the resulting changes to be positive for our precious metals companies. Investment Thesis Review for our Top 5 Positions by Weight Thesis Gold: 10.2% Portfolio Weight Thesis steadily advanced its Lawyers-Ranch project in British Columbia in 2025. Most notably, in December the company formally initiated the provincial and federal Environmental Assessment process, which starts the permitting clock. Typically, the permitting process would take 3 years, but the government of British Columbia has indicated they would like to complete this sooner. Thesis Gold shares’ outperformance, up 325%, reflects not only their permitting progress, but also the growing possibility of a bidding war for the company. In May 2025, Centerra Gold took a 9.9% stake in Thesis. Given Centerra’s strong financial position (net cash balance sheet and substantial annual free cash flow) and the proximity of their Kemess project to Lawyers-Ranch, they are a likely bidder when their lockup expires in May of this year. That said, we believe with Lawyers-Ranch’s attractive size and location profile, the project should eventually attract offers from multiple intermediate producers. Furthermore, with revaluation of the silver price, the project’s silver content has become increasingly valuable. At strip prices, over 30% of the project’s revenue would be attributable to silver. While Lawyers-Ranch won’t attract the premium of a pure-silver asset, the high silver weighting makes it appropriate for silver companies, thereby increasing the upside multiple. Thesis is not dependent upon a bid to develop their project. They are fully financed through the expected completion of their Feasibility Study in 2027 and could easily finance the entire mine construction capex by selling a silver royalty. Once in production, Thesis should produce 200,000 ounces of gold equivalent per year for 15 years. With a $550 million market cap, we calculate this investment to be a 30%+ IRR assuming flat metals prices. Solidcore Resources: 9.8% Portfolio Weight In 2025, Solidcore made significant progress towards cutting its remaining ties to Russia. Notably, they bought back all the shares held in Russian depository and meaningfully advanced the construction of their new Kazakhstan-based POX plant. With the completion of the Russian share buyback on December 19th, 2025, Solidcore ended a multi-year standoff with Euroclear and created a path to reinstating their dividend. With respect to the POX plant, Solidcore successfully transported their new 1,100-ton autoclave manufactured in Belgium to site in Ertis, Kazakhstan, which was a year-long, technically demanding logistics operation. It required night-time transportation, reinforced roads, and careful coordination to avoid disrupting city life. With the autoclave now in place, the project has begun to ramp full-scale POX construction. We believe the new POX plant could be up and running by year-end 2027, at which point we would expect Solidcore to re-list their stock on the London Stock Exchange. CEO Vitaly Nesis is working to put in place a world-class board and, along with an LSE-listing, recapture the premium valuation that Polymetal garnered prior to the Russian invasion of Ukraine. It is not often that a CEO gets to build the same company twice, but we think that will be the case for Vitaly Nesis and Solidcore. The scale of the revaluation opportunity for Solidcore remains mouthwatering. With a current market cap of $3.5 billion, net cash of $1 billion, and annual free cash flow of $1 billion, Solidcore trades at a 2.5x Enterprise Value to FCF (EV/FCF) multiple. Similarly sized peers typically trade at a 10x EV/FCF multiple or more. We think the dividend will be an initial catalyst for revaluation, and the ultimate revaluation will occur when the equity re-lists on the LSE. Troilus Mining: 7.8% Portfolio Weight Troilus changed their narrative from "if they" to "when they” go into construction by securing $700 million in project financing in March 2025, which they later upsized to a $1 billion package in November. The $1 billion debt financing covers more than 70% of the project’s $1.3 billion capex. Last December, Troilus raised an additional $175 million of equity, and we expect the $125 million balance of construction cost will be easily financed by selling a royalty on the mine’s by-product metals, such as silver. On the regulatory and permitting front, in June, the company submitted their Environmental and Social Impact Assessment (ESIA) to the Government of Canada and Government of Quebec. Importantly, government officials have identified the Troilus project as one of the country’s 10 key natural resource developments of interest. Mark Carney even traveled to Berlin with Troilus to sign their offtake agreement, removing any doubt about government support for the project. This de-risking, both operationally and financially, has positioned Troilus as one of a select few large-scale projects advancing towards construction in Canada. When in production, the Troilus mine will produce an average of 303,000 ounces annually for 22 years at an estimated All-In Sustaining Cost of $1,450 per ounce. When the gold price was $2,000, Troilus was a marginal project in a good jurisdiction. Now with gold trading north of $5,000, Troilus is a high return project in a good jurisdiction. Troilus shares re-rated aggressively in 2025, but the company still only trades at a market capitalization of $650 million, more than a 70% discount to the project’s Net Present Value (using a 5% discount rate and spot metals prices). The mine will be the 5th largest gold mine in Canada, and we anticipate that several large mining companies will have a close look at the project before Troilus makes a final investment decision in December 2026. Hochschild Mining: 7.5% Portfolio Weight Hochschild overcame early operational headwinds at their new Mara Rosa mine in Brazil to finish the year with significant momentum. Despite a summer production warning and subsequent leadership transition at the COO level, the company met its revised annual guidance of over 300,000 gold equivalent ounces. Hochschild's portfolio is anchored by the high-margin Inmaculada mine in Peru which produced 5.6 million ounces of silver last year. Because of Inmaculada, ~40% of Hochschild's revenue is derived from silver at today’s spot prices. Such a high level of silver exposure is unusual and should result in a premium valuation. With a $4.8 billion market cap with no net debt and over $550 million of expected free cash flow in 2026, Hochschild’s valuation reflects no such premium. Hochschild’s new COO Cassio Diedrich (formerly Global Head of Mining for Base Metals at Vale) brings the specific regional and technical expertise required to optimize the growing Brazilian portfolio. Furthermore, the addition of a Brazil Country Manager with a pedigree from Lundin Mining and Yamana Gold significantly de-risks the execution of the Monte do Carmo build. If Hochschild executes on their growth plan, the company could generate over $1 billion in annual free cash flow by 2028. They are now in a strong financial position to fund both growth capex and a meaningful dividend internally from free cash flow. West African Resources: 7.2% Portfolio Weight In 2025, West African Resources (WAF) brought their new Kiaka mine into production on time and on budget. Now with two large, low cost and long-lived mines, WAF is the largest and most profitable gold producer in Burkina Faso. We expect WAF to produce more than 470,000 oz per year through 2040. Unfortunately, the company’s success has not gone unnoticed in cash-strapped Burkina Faso. In September, the government of Burkina Faso expressed their interest in acquiring an additional 35% of the newly completed Kiaka mine as was allowed by the country’s 2022 mining code. As the government does not have the cash to pay for an additional 35%, and the request appears to be an extra-legal attempt to increase the government’s free carry. The uncertainty caused by the government’s effort to up their stake in the Kiaka mine created a cascade of problems for WAF. Most importantly, their shares were suspended on the Australian stock exchange while the uncertainty was sorted out. While the government of Burkina Faso seems to have lost its enthusiasm for a transaction, WAF still must deal with the overhang and optics of the approach. The result is a particularly cheap stock reflecting the political uncertainty of operating in Burkina Faso. WAF has an equity market cap of $2.5 billion and will generate close to $1 billion in annual free cash flow. This exceptionally low valuation comes despite the long-lived and low-cost high-quality assets the company has put into production. The more recent Kiaka mine has a planned life until 2043 and the Sanbrado mine, which started production in 2020, has a modelled life through 2034 that will likely be extended by several years. The aggregate life of mine All-In Sustaining Costs (AISC) for WAF’s projects are just under $1,700 per ounce, putting WAF into the better half of the global gold mining cost curve. We expect the uncertainty around the operating environment in Burkina Faso to clarify over the course of 2026 and 2027. The government, at every level, now understands that it receives the majority of the economics of WAF’s gold mines operated in Burkina Faso. Additionally, with gold mining as the chief economic engine for the country, the government’s interests are best served in both the short and long run by encouraging gold mining and extracting their majority share of the economics. Negotiating for more of the economics simply makes it impossible to attract companies to make incremental investments in the country.
By Kieran Brennan January 28, 2026
Dear Partners and Friends, PERFORMANCE K uroto Fund, L.P. appreciated +8.5% in the fourth quarter and finished the year up +64.9%. By comparison, the broad MSCI Emerging Markets Index rose +4.8% in the quarter, finishing the year up +34.4%. The positive contributors to Kuroto’s performance were broad-based, with 11 stocks contributing over $1 million of gains for the year and only 2 positions detracting more than $1 million. The biggest contributors to the performance were MTN Ghana, our Nigerian stocks, and Georgia Capital. The biggest detractors were Kosmos Energy and Gran Tierra. Looking at our portfolio today, we are surprised at how attractive it still looks given our performance last year. Our portfolio’s price to earnings ratio is 5.9x for 2026, with a dividend yield of 6%, generating an ROE of 28%. While these are imperfect metrics, they don’t show a portfolio that’s expensive. We take a more nuanced look at the valuation of our top five positions below, which represent 61% of the portfolio today. Moreover, we are still finding attractive incremental investment opportunities. In this regard, Brazil stands out as a particularly attractive incremental market for us. With policy rates at 15%, local investors are happy to hold fixed income securities which has kept equity valuations depressed. As concerns about US economic policy grow, risk capital should flow to emerging and frontier markets. US equities account for 47% of total equity value globally. Brazil, by contrast, accounts for just 0.6% of global equity value. Needless to say, a small shift from US equity markets to EM markets could result in a meaningful upward revaluation of emerging market stock markets such as Brazil’s. A breakdown of Kuroto Fund exposures can be found here . Investment Thesis Review for the Top Five Positions by Portfolio Weight MTN Ghana: 20.5% Portfolio Weight MTN Ghana continues to be our largest investment. Through the first nine months of 2025 (full year results are not yet released), the company’s revenue grew 36.2% and earnings were up 45.9%. It generated a ROE of over 50% and is on track to pay out 80% of earnings in dividends. The company continues to dominate the voice and data telecom services market, as well as money transfer and digital payments in the country. The biggest growth driver of the business has been data. Our understanding is that latent demand for data is such that any investment MTN Ghana makes into its telecom infrastructure is immediately utilized. MTN has not been under-investing in infrastructure, but its competitors have been. The second largest competitor was Vodacom, but they sold out to Telecel in 2023. Since purchasing Vodacom Ghana, Telecel has underinvested in its network and has been losing market share. The third and fourth largest networks, Bharti Airtel and Tigo, merged their operations in 2017 to attempt to compete more effectively, but they did not invest enough to be competitive and ended up selling to the government in 2021 for $1. Since then, the government has absorbed the third player’s operating losses while not investing meaningfully in infrastructure. Currently, the government is considering both selling a stake to remove ongoing losses as well merging its Airtel-Tigo with Telecel to create a stronger competitor to MTN Ghana. Combining two under-invested networks will not fix the problem unless someone commits to spending a meaningful amount of capital to add to and upgrade telecom infrastructure. MTN Ghana has invested over $3 billion to make its network the dominant one in the country. It’s unlikely someone will come forward to write a check big enough to meaningfully alter that dynamic. The second biggest growth driver, and potentially the most valuable piece of the business longer term is the mobile financial services business – MoMo. MTN continues to dominate money transfers and payments in the country with 90%+ market share. In early 2025, the government removed the e-levy tax on money transfer which spurred growth for the year. Now the service mix is shifting to higher value services like merchant payments and savings and lending products and away from pure person-to-person money transfer. The company recently separated its mobile financial services business from its telecom business internally, and going forward will report the financials of these businesses independently. The company is guiding that in 3-5 years they will list the mobile financial services business separately. It’s possible that this leads to a higher valuation for the group at some point, as these sorts of fintech businesses tend to trade at much higher multiples than telecom businesses. In our estimates, we see the stock currently trading at 5.6x our estimate of 2026 earnings, earning a 55% ROE and paying out a 10.7% dividend yield. The company forecasts high-30s% revenue growth in the medium term, stable margins, and a continued 80%+ payout ratio. Georgia Capital: 12.2% Portfolio Weight Georgia Capital had a great year. From December 2024 to the end of Q3 2025, the company’s NAV per share increased 42%. And for the full year 2025, the company is forecasting a 46% increase in FCF per share. The share price outpaced the intrinsic value growth, and the discount to the sum of the parts that the stock trades at has come in from ~50% discount at year end 2024 to a ~25% discount today. There were three big drivers of Georgia Capital’s performance in 2025. The first was the strong performance of its largest holding, Lion Finance Group (formerly known as the Bank of Georgia). Since 2019, when current CEO Archil Gachechiladze took over, Lion Finance Group has transformed from a good bank into a great one. The ROE expectation has increased from low-20s% to high 20s%, Net Promoter Score has increased from mid-30s to mid-70s, and 2025 EPS is forecast to be nearly 5x what it was in 2019. In 2025, the bank continued to perform strongly and is now getting recognized for it in the stock market. Listed in London, it is now a FTSE 100 stock, and having had traded around 1x book value for the past 5 years, is now at closer to 1.5x Price to Book Value. We think the bank will continue to grow revenues at a double-digit percentage, earn a high 20s% ROE, and support a 5%+ dividend yield. As such, we think Lion Finance Group stock still trades at a very reasonable valuation, and are comfortable with it as just over half of Georgia Capital’s NAV. The second big driver for Georgia Capital in 2025 was its aggressive share repurchase program. Since merging with its healthcare subsidiary in August 2020, Georgia Capital has shrunk its share count from 47.9 million shares to 35.4 million at the end of Q3 2025. From Q1 through Q3 this year, they repurchased 10.4% of their beginning of 2025 shares outstanding and continued to buyback through Q4. They funded this aggressive buyback through a combination of operating cash flow, selling down some of the group’s stake in the bank, and disposing of some non-core assets. Repurchasing shares while trading at a substantial discount to NAV is a good recipe for NAV per share growth, and Georgia Capital did a lot of that this year. Now that the discount has closed to a ~25% discount, this is less attractive but still reasonable given that look-through valuation is still only a single digit P/E multiple. The third key 2025 driver for Georgia Capital was the increase in value of the rest of Georgia Capital’s portfolio. The biggest pieces of the group after the bank are its pharmacy business, hospital business, and insurance company. Pharmacy and hospitals saw a 21.1% and 38.7% increase in operating cash flow respectively, and insurance saw a 23% increase in profit before tax. We expect continued double-digit profit growth in the medium term for these businesses, though not 20%+, which was helped by a cyclical margin recovery in 2025. Currently, our look-through P/E multiple for the group is 7x, which is attractive for this combination of businesses that earn good returns on capital and grow earnings double digits. Going forward, we anticipate growth will be driven more by earnings growth and capital returns rather than a decrease in the holding company discount to the sum of the parts. As such, we’ve trimmed the position modestly. Seplat Energy: 12.2% Portfolio Weight Seplat acquired Exxon Mobil’s shallow water operating unit in December 2024, more than doubling the size of its production and reserves. As a result, 2025 was a year of asset integration. Thus far, the company has managed the much larger production base well. Production averaged 135,000 barrels of oil equivalent per day (boepd) in the first three quarters of 2025, up from less than 50,000 boepd prior to the acquisition. Seplat has maintained this level of production throughout the year without drilling any incremental wells into the former Exxon Mobil assets, only reactivating old, previously shut-in wells. In fall of 2025, Seplat unveiled their 5-year plan for the newly combined portfolio. Encouragingly, Seplat was able to keep most of the Exxon Mobil in-country team, many of whom have 20+ years of experience with these assets and were trained to Exxon’s global standards. This makes the five-year plan to grow corporate production from 130,000 boepd to 200,000 boepd look very achievable. Seplat is trading at a high single digit FCF yield at the current low-$60 oil price. Debt to cash flow is less than 1x. They plan to pay out 45% of FCF as dividends while also investing to grow production approximately 9% per year for the next 5 years. Assuming a $65 Brent oil price, Seplat is guiding for a cumulative $2 to $3 billion in FCF over the next 5 years, which compares to their equity market cap of $2.5 billion. By 2030, Seplat should be producing over 200,000 boepd, generating north of $500 million in FCF annually and still have a long growth runway ahead. That said, it is no longer as enormous of an outlier in terms of valuation relative to some other emerging market oil and gas ideas we have, two of which are trading at north of 20% free cash flow yield today or in the next six months. Solidcore Resources: 11.8% Portfolio Weight In 2025, Solidcore made significant progress towards cutting its remaining ties to Russia. Notably, they bought back all the shares held in Russian depository and meaningfully advanced the construction of their new Kazakhstan-based POX plant. With the completion of the Russian share buyback on December 19th, 2025, Solidcore ended a multi-year standoff with Euroclear and created a path to reinstating their dividend. With respect to the POX plant, Solidcore successfully transported their new 1,100-ton autoclave manufactured in Belgium to site in Ertis, Kazakhstan, which was a year-long, technically demanding logistics operation. It required night-time transportation, reinforced roads, and careful coordination to avoid disrupting city life. With the autoclave now in place, the project has begun to ramp full-scale POX construction. We believe the new POX plant could be up and running by year-end 2027, at which point we would expect Solidcore to re-list their stock on the London Stock Exchange. CEO Vitaly Nesis is working to put in place a world-class board and, along with an LSE-listing, recapture the premium valuation that Polymetal garnered prior to the Russian invasion of Ukraine. It is not often that a CEO gets to build the same company twice, but we think that will be the case for Vitaly Nesis and Solidcore. The scale of the revaluation opportunity for Solidcore remains mouthwatering. With a current market cap of $3.5 billion, net cash of $1 billion, and annual free cash flow of $1 billion, Solidcore trades at a 2.5x Enterprise Value to FCF (EV/FCF) multiple. Similarly sized peers typically trade at a 10x EV/FCF multiple or more. We think the dividend will be an initial catalyst for revaluation, and the ultimate revaluation will occur when the equity re-lists on the LSE. Guaranty Trust: 8.9% Portfolio Weight Guaranty Trust performed well in 2025, posting a 31% ROE while growing their loan book by 16%. Earnings per share declined 6% YoY due to the normalization of their foreign currency earnings (rather than any deterioration in the business). After a lost decade under the former President Buhari, Nigeria is now beginning to grow again. GDP grew at 4% in 2025 despite weak oil prices, and government foreign exchange reserves are again healthy. Where inflation ran at 25% a year ago, it dropped to 14.5% as of November 2025. We expect Nigerian interest rates to follow inflation lower, which should spur loan growth. For the first time we can remember, Nigerian businesses are borrowing and investing, the currency has been stable, and the locals we speak to are genuinely optimistic. With a capital ratio of over 40% and a loan-to-deposit ratio of only 27%, Guaranty Trust remains Nigeria’s most conservative bank. With a cost of funding of only 3% and a cost to income ratio of sub-30%, Guaranty Trust doesn’t have to take much credit risk to generate spectacular returns on equity. Not surprisingly, simply owning government bonds is their preferred strategy in the current rate environment. Today, Guaranty Trust trades at 3.3x forward earnings and just less than book value. We expect the company to continue earning at least a high-20s% ROE, which should support both a 10%+ dividend yield and strong loan growth. Sincerely, Sean Fieler & Brad Virbitsky
By Kieran Brennan January 28, 2026
Dear Partners and Friends, PERFORMANCE Equinox Partners, L.P. rose +17.3% net of fees in the fourth quarter, finishing the calendar year 2025 up +80.9%. By comparison, the S&P 500 index rose +2.7% in the fourth quarter and +17.9% for the year. Our precious metal miners accounted for the vast majority of our gains last year. Our relatively small exposure to non-commodity Operating Companies in Frontier & Emerging markets also performed extremely well. Our energy equities declined modestly, and our equity shorts were roughly P&L neutral for the year. Trump's War on the Status Quo It is no coincidence that our strong performance in 2025 corresponded with the first year of President Trump’s second term. Trump’s frontal assault on the international rules-based order ended decades of coordination between America and Europe, thereby liberating gold and silver from organized government price suppression. Looking ahead to the remainder of Trump’s second term, we expect additional long-dormant market forces to be unleashed as the Western coalition that maintained the post-war economic system breaks down. We also expect America’s unilateral market interventions (such as the current effort to suppress the oil price) to be less successful than the coordinated interventions that characterized the post-World War II era. The uninterrupted rise in the gold price last year was in large part due to deteriorating relations between the US and Europe. In a break with eighty years of history, at no point did any Western government so much as feign interest in the gold price rally. Neither France, nor Italy, nor the IMF threatened to sell any of their substantial gold reserves. Instead, the gold price suppression scheme run by Western governments for decades simply vanished. We don’t know if the Trump administration formally decided to abandon America’s policy of gold price management or if the fraught relationship between Europe and the US simply made continued coordination in the gold market impossible. Perhaps Western governments collectively concluded that a gold price suppression scheme had become untenable given the growing list of government gold buyers. Regardless of the cause, the Western government policy of gold price suppression appears to be over. In a related break with the status quo, Western governments and their financial institutions also stopped managing the silver market. We sense that silver price suppression was never an end in and of itself. Rather, controlling the price of silver was necessary to credibly control the price of gold given the close correlation between the two metals. Accordingly, if the gold market isn’t managed, then neither does the silver market need to be. It’s unfortunate that Trump has paired his liberation of gold and silver with the enthusiastic suppression of the oil price. This, too, is a break with the status quo. We are aware that for most of the post-war period, America has worked with a coalition of Western oil consuming countries to ensure the long-term availability of oil at reasonable prices. But Trump’s policy of targeting an uneconomic oil price is unprecedented. Should Trump achieve his stated goal of $50 oil, such a low price will prove unsustainable. With oil averaging $60 over the past year, there has been no increase in US production and non-OPEC supply increases have been muted. Perhaps direct government subsidies can spur a supply increase from Venezuela, but that remains to be seen. Absent new government subsidies, oil production growth will prove a challenge at $60, let alone $50. Harold Hamm, a close Trump confidant, has conveyed this message to Trump. Presumably, Trump realizes his policy of oil price suppression is unsustainable. We certainly do. While America’s next president may pursue a different policy posture towards Europe, America’s relationship with Europe is forever altered. This change will eventually be reflected institutionally and geopolitically, but its effect can already be seen in the markets. The rising gold price is just one of the first signs of this change. While America’s break up with Europe will at times be unsettling, we expect the resulting changes to be positive for our commodity exposures, as well as our deeply discounted companies in Frontier and Emerging markets. Investment Thesis Review for our Top 5 Long Positions By portfolio Weight Solidcore Resources: 11.8% Portfolio Weight In 2025, Solidcore made significant progress towards cutting its remaining ties to Russia. Notably, they bought back all the shares held in Russian depository and meaningfully advanced the construction of their new Kazakhstan-based POX plant. With the completion of the Russian share buyback on December 19th, 2025, Solidcore ended a multi-year standoff with Euroclear and created a path to reinstating their dividend. With respect to the POX plant, Solidcore successfully transported their new 1,100-ton autoclave manufactured in Belgium to site in Ertis, Kazakhstan, which was a year-long, technically demanding logistics operation. It required night-time transportation, reinforced roads, and careful coordination to avoid disrupting city life. With the autoclave now in place, the project has begun to ramp full-scale POX construction. We believe the new POX plant could be up and running by year-end 2027, at which point we would expect Solidcore to re-list their stock on the London Stock Exchange. CEO Vitaly Nesis is working to put in place a world-class board and, along with an LSE-listing, recapture the premium valuation that Polymetal garnered prior to the Russian invasion of Ukraine. It is not often that a CEO gets to build the same company twice, but we think that will be the case for Vitaly Nesis and Solidcore. The scale of the revaluation opportunity for Solidcore remains mouthwatering. With a current market cap of $3.5 billion, net cash of $1 billion, and annual free cash flow of $1 billion, Solidcore trades at a 2.5x Enterprise Value to FCF (EV/FCF) multiple. Similarly sized peers typically trade at a 10x EV/FCF multiple or more. We think the dividend will be an initial catalyst for revaluation, and the ultimate revaluation will occur when the equity re-lists on the LSE. Troilus Mining: 10.9% Portfolio Weight Troilus changed their narrative from "if they" to "when they” go into construction by securing $700 million in project financing in March 2025, which they later upsized to a $1 billion package in November. The $1 billion debt financing covers more than 70% of the project’s $1.3 billion capex. Last December, Troilus raised an additional $175 million of equity, and we expect the $125 million balance of construction cost will be easily financed by selling a royalty on the mine’s by-product metals, such as silver. On the regulatory and permitting front, in June, the company submitted their Environmental and Social Impact Assessment (ESIA) to the Government of Canada and Government of Quebec. Importantly, government officials have identified the Troilus project as one of the country’s 10 key natural resource developments of interest. Mark Carney even traveled to Berlin with Troilus to sign their offtake agreement, removing any doubt about government support for the project. This de-risking, both operationally and financially, has positioned Troilus as one of a select few large-scale projects advancing towards construction in Canada. When in production, the Troilus mine will produce an average of 303,000 ounces annually for 22 years at an estimated All-In Sustaining Cost of $1,450 per ounce. When the gold price was $2,000, Troilus was a marginal project in a good jurisdiction. Now with gold trading north of $5,000, Troilus is a high return project in a good jurisdiction. Troilus shares re-rated aggressively in 2025, but the company still only trades at a market capitalization of $650 million, more than a 70% discount to the project’s Net Present Value (using a 5% discount rate and spot metals prices). The mine will be the 5th largest gold mine in Canada, and we anticipate that several large mining companies will have a close look at the project before Troilus makes a final investment decision in December 2026. Silver Futures: 9.0% Portfolio Weight Despite the more than three-fold increase in the silver price since January 2024, the supply and demand deficit for the metal hasn’t improved much. Beginning with supply, we expect a de minimis year over year increase in mine supply in 2026 and a 30-million-ounce uptick in recycling. Taken together, we forecast total silver supply will increase 4% in 2026. It’s worth noting that an uptick in recycling is likely a one-time phenomenon, and going forward silver supply growth will depend solely on mine supply. On this point, despite the high silver price, we expect very little mine supply growth again in 2027. Sustained increases in silver mine supply require a more permissive permitting regime in countries such as Mexico, Guatemala, Peru and Chile. Even at $100 an ounce, we expect industrial demand for silver to remain basically flat. Silver is used in industrial applications because of the unique attributes of its valence electrons, and there is no good substitute in most cases. Absent government restrictions on silver use, we don’t foresee much of a decline in industrial silver demand. The one area of possible demand destruction is in Indian silverware purchases. Given the inelasticity of both silver supply and demand, we foresee only a modest increase in the metal available for investment to 150 million ounces. (See supply and demand table below) Importantly, a sizable fraction of these 150 million ounces will be consumed by mints producing silver coins. Most incremental investment demand will have to be met by existing owners of metal and the physical silver market will remain tight. We remain bullish, but we’ve trimmed 80% of our silver ounces given the price move.
By Kieran Brennan November 11, 2025
Value Investor Insight Profile with Sean Fieler and Brad Virbitsky
By Kieran Brennan October 31, 2025
Dear Partners and Friends, PERFORMANCE Equinox Partners Precious Metals Fund, L.P. rose +36.2% in the third quarter of 2025 and is up +90.2% for the year-to-date 2025. By comparison, the Junior Gold Mining Index GDXJ rose +46.6% in the quarter and is up +132.7% for the year-to-date. Exploration stage companies were the best performing segment of the portfolio, appreciating +55.0% in the quarter. The spot gold price rose +18% in the quarter and is up +47% for the year-to-date. The letter that follows provides our thoughts on the outlook for the gold price and implications for the portfolio holdings. gold The gold bull market, initially driven by central bank buying, has evolved into an investor-driven dollar debasement trade. This second phase of the gold bull market is more explosive than the first because it draws on the approximately $470 trillion of the world’s wealth as opposed to the roughly $35 trillion of central bank balance sheets. If President Trump fans the dollar debasement fire by forcing a politicized Fed to cut rates, gold could rapidly displace the dollar as the world’s reserve currency. However, if President Trump takes a more nuanced approach to the Fed, gold should still displace the dollar as the world’s reserve currency over time with the competition between gold and the dollar taking longer to play out. Gold investors warning about fiat currency debasement is nothing new. That, after all, is why gold investors own gold in the first place. There’s also nothing new about most American investors ignoring these warnings. The dollar’s relative stability has long made concerns about dollar debasement appear quixotic. Since the early 1980’s, American inflation has been largely tolerable, the dollar has outperformed almost all other fiat currencies, and U.S. government bonds have been the safest asset to own in an economic downturn. The dollar has sloughed off so much criticism for so long that Janet Yellen likely did not imagine the chain of events that freezing Russia’s foreign exchange reserves would set into motion. With confidence in the dollar’s inertia and a bit of hubris, in our opinion, Secretary Yellen engineered the freezing of $300 billion of Russia’s foreign exchange reserves and put the world’s central banks on notice that their use of dollar reserves depends upon the tacit approval of the U.S. Treasury. Foreign governments, shocked by this policy change, sought to reduce their dependence on the U.S. Treasury and doubled their gold purchases to roughly $60-80 billion per year (potentially $100 billion in 2025). This increase in central bank gold demand drove the gold price up over +50% from March 2022 to March 2025. This bull market, in turn, gave gold the additional scale necessary to function as a more viable alternative to the dollar and damaged the dollar’s air of invulnerability. This two-fold outcome is problematic because inertia and a lack of alternatives were fundamental to the dollar’s stability. On the back of gold’s appreciation, long-ignored arguments of gold investors began sounding more plausible. Financial professionals accustomed to deriding gold investors and referring to them as insects began to worry that gold’s price action is telling them something important. Jamie Dimon aptly summed up the change of heart: “This is one of those times where it is semi-rational to own gold.” His comment captures both his continued distaste for gold and his willingness to own it. Despite the broadening acceptance of gold as an investment, markets remain skeptical of the underlying dollar-devaluation narrative. Inflation, a broad measure of the dollar’s strength, is just 2.8%. The 10-year U.S. Treasury yields 4.0%, indicating the bond market’s indifference to the dollar debasement narrative. Furthermore, the decline in the trade weighted dollar has partially reversed since early July. At this moment, the dollar debasement trade appears to be waiting for additional macroeconomic and geopolitical events to play out. Of these, none looms larger than President Trump’s effort to bend the Federal Reserve to his will. In January, the Supreme Court will likely allow President Trump to remove Federal Reserve Board Governor Lisa Cook, making the selection of the next Fed Chair even more important. If Trump nominates a loyalist like Kevin Hassett who appears more committed to pleasing the President than price stability, we could see broadening concern about the dollar’s store of value and a growing asset allocation into gold. In this hyper-politicized Fed scenario, gold could quickly become a $100 trillion dollar asset and displace the dollar as the world’s reserve currency. However, if Trump nominates an institutionalist like Chris Waller, the dollar debasement trade will likely remain in limbo for a while as markets suss out how much control Trump really has over the Fed. Either way, the U.S. bond market will not be allowed to freely adjudicate the outcome at the Fed. We expect both Treasury and Fed to proactively manage the yield curve during the particularly politically sensitive period when the Fed is cutting rates while inflation is above their stated 2% target. Treasury will keep longer-dated bond issuance to a minimum while coercing banks to keep the Treasury market well bid. JP Morgan increased its holdings of Treasuries by $80 billion in the first half of this year, and we expect other banks to follow suit. The Fed, for its part, has announced an end to quantitative tightening and its intention to shift its balance sheet from mortgage-backed securities to Treasuries. Given the likely extent of the coordinated intervention of the Treasury and Fed, the bond market will not be a good indicator of the market’s confidence in Trump’s economic policies. Gold will be. To the extent that investors sense that the bond market is not providing a reliable price signal, they will begin paying more attention to gold. And, should the gold price becomes the accepted indicator of U.S. financial health, the Trump administration will take action to influence it. At the very least, this will entail the Trump administration encouraging other central banks to stop buying gold or even sell gold. But the anti-gold policy options are limitless. Needless to say, the U.S. government pushback on gold will not solve the dollar’s long-term structural problems. Nor will it mark the end of gold’s challenge to the dollar. It will simply mark the next phase of financial repression. Our Gold Mines The second phase of the bull market in gold has been broadly positive for our portfolio, as a portion of the investor money flowing into gold has bid up gold mining equities as well. Where central banks buy the physical gold bullion, private wealth investors allocating to gold will also buy gold mining stocks. The GDXJ Junior Mining Index is up +132.7% for the year-to-date through September 30. Even with this year’s rapid rise in the gold mining portfolio, valuations remain cheap at spot gold prices. Our in-production portfolio trades at a 24.0% IRR as compared to a 23.4% IRR on March 31. The most dramatic mis-valuation among our gold miners continues to be in the pre-production companies. While these equities have appreciated more rapidly than our producing companies for the year-to-date 2025, they began from such a low valuation that even at twice or three times their January price, they are still undervalued. Troilus Gold, a junior gold mining company with an 11.2 million ounces gold-equivalent resource in Quebec, Canada, is a case in point. Troilus Gold shares have more than tripled in 2025, rising from C$0.31 to C$1.35 per share. The company still trades at an IRR of 30%, 0.2x price-to-NAV (using a 10% discount rate), and a price per ounce of recoverable gold of $63. When Troilus goes into commercial production in 2029, we expect it will generate annual net income roughly equal to its current market cap. Troilus historically traded at an extremely low valuation because the market did not believe that the company could finance the project's upfront capital expenditure of $1.3 billion. Throughout 2025, Troilus began addressing these financing concerns by signing an offtake agreement with a European smelter and a related letter of intent for $700 million of debt financing on attractive terms. If Troilus Gold raises the necessary equity and signs a streaming arrangement to fully fund the mine’s construction, we believe the stock will trade much closer to its NAV (using a 10% discount rate and the spot gold price) of $2.5 billion.
By Kieran Brennan October 30, 2025
Dear Partners and Friends, PERFORMANCE Equinox Partners, L.P. rose +24.5% net of fees in the third quarter and is up +54.4% for the year-to-date 2025. By comparison, the S&P 500 index rose +8.1% in the third quarter and is now up +14.8% for the year-to-date 2025. Our quarterly performance has been almost exclusively driven by our gold and silver miners. In the third quarter, the spot gold price rose +18%, and the fund’s mining portfolio returned +40%. As of this writing, 78% of Equinox Partners’ capital is invested in the gold and silver sector. The letter that follows provides our thoughts on the gold price and our gold mining holdings. Gold The gold bull market, which was initiated by central bank buying, has evolved into an investor-driven dollar debasement trade. This second phase of the gold bull market is more explosive than the first because it draws on the approximately $470 trillion of the world’s wealth as opposed to the roughly $35 trillion of central bank balance sheets. If President Trump fans the dollar debasement fire by forcing a politicized Fed to cut rates, gold could rapidly displace the dollar as the world’s reserve currency. However, if President Trump takes a more nuanced approach to the Fed, gold should still displace the dollar as the world’s reserve currency over time with the competition between gold and the dollar taking longer to play out. Gold investors warning about fiat currency debasement is nothing new. That, after all, is why gold investors own gold in the first place. There’s also nothing new about most American investors ignoring these warnings. The dollar’s relative stability has long made concerns about dollar debasement appear quixotic. Since the early 1980’s, American inflation has been largely tolerable, the dollar has outperformed almost all other fiat currencies, and U.S. government bonds have been the safest asset to own in an economic downturn. The dollar has sloughed off so much criticism for so long that Janet Yellen likely did not imagine the chain of events that freezing Russia’s foreign exchange reserves would set into motion. With confidence in the dollar’s inertia and a bit of hubris in our opinion, Secretary Yellen engineered the freezing of $300 billion of Russia’s foreign exchange reserves and put the world’s central banks on notice that their use of dollar reserves depends upon the tacit approval of the U.S. Treasury. Foreign governments shocked by this policy change sought to reduce their dependence on the U.S. Treasury and doubled their gold purchases to roughly $60-80 billion per year (potentially $100 billion in 2025). This increase in central bank gold demand drove the gold price up over +50% from March 2022 to March 2025. This bull market in turn gave gold the additional scale necessary to function as a more viable alternative to the dollar and damaged the dollar’s air of invulnerability. This two-fold outcome is problematic because inertia and a lack of alternatives were fundamental to the dollar’s stability. On the back of gold’s appreciation, long-ignored arguments of gold investors began sounding more plausible. Financial professionals accustomed to deriding gold investors and referring to them as insects began to worry that gold’s price action is telling them something important. Jamie Dimon aptly summed up the change of heart: “This is one of those times where it is semi-rational to own gold.” His comment captures both his continued distaste for gold and his willingness to own it. Despite the broadening acceptance of gold as an investment, markets remain skeptical of the underlying dollar-devaluation narrative. Inflation, a broad measure of the dollar’s strength, is just 2.8%. The 10-year U.S. Treasury yields 4.0%, indicating the bond market’s indifference to the dollar debasement narrative. Furthermore, the decline in the trade weighted dollar has partially reversed since early July. At this moment, the dollar debasement trade appears to be waiting for additional macroeconomic and geopolitical events to play out. Of these, none looms larger than President Trump’s effort to bend the Federal Reserve to his will. In January, the Supreme Court will likely allow President Trump to remove Federal Reserve Board Governor Lisa Cook, making the selection of the next Fed Chair even more important. If Trump nominates a loyalist like Kevin Hassett who appears more committed to pleasing the President than price stability, we could see broadening concern about the dollar’s store of value and a growing asset allocation into gold. In this hyper-politicized Fed scenario, gold could quickly become a $100 trillion dollar asset and displace the dollar as the world’s reserve currency. However, if Trump nominates an institutionalist like Chris Waller, the dollar debasement trade will likely remain in limbo for a while as markets suss out how much control Trump really has over the Fed. Either way, the U.S. bond market will not be allowed to freely adjudicate the outcome at the Fed. We expect both Treasury and Fed to proactively manage the yield curve during the particularly politically sensitive period when the Fed is cutting rates while inflation is above their stated 2% target. Treasury will keep longer-dated bond issuance to a minimum while coercing banks to keep the Treasury market well bid. JP Morgan increased its holdings of Treasuries by $80 billion in the first half of this year, and we expect other banks to follow suit. The Fed, for its part, has announced an end to quantitative tightening and its intention to shift its balance sheet from mortgage-backed securities to Treasuries. Given the likely extent of the coordinated intervention of the Treasury and Fed, the bond market will not be a good indicator of the market’s confidence in Trump’s economic policies. Gold will be. To the extent that investors sense that the bond market is not providing a reliable price signal, they will begin paying more attention to gold. And, should the gold price becomes the accepted indicator of U.S. financial health, the Trump administration will take action to influence it. At the very least, this will entail the Trump administration encouraging other central banks to stop buying gold or even sell gold. But the anti-gold policy options are limitless. Needless to say, the U.S. government pushback on gold will not solve the dollar’s long-term structural problems. Nor will it mark the end of gold’s challenge to the dollar. It will simply mark the next phase of financial repression. Our Gold Mines The second phase of the bull market in gold has been broadly positive for our portfolio, as a portion of the investor money flowing into gold has bid up gold mining equities as well. Where central banks buy the physical gold bullion, private wealth investors allocating to gold will also buy gold mining stocks. The GDXJ Junior Mining Index is up +131% for the year-to-date through September 30. Even with this year’s rapid rise in the gold mining portfolio, valuations remain cheap at spot gold prices. Our in-production portfolio trades at a 24% IRR as compared to a 25% IRR on March 31. The most dramatic mis-valuation among our gold miners continues to be in the pre-production companies. While these equities have appreciated more rapidly than our producing companies for the year-to-date 2025, they began from such a low valuation that even at twice or three times their January price, they are still undervalued. Troilus Gold, a junior gold mining company with an 11.2 million ounces gold-equivalent resource in Quebec, Canada, is a case in point. Troilus Gold shares have more than tripled in 2025, rising from C$0.31 to C$1.35 per share. The company still trades at an IRR of 30%, 0.2X its NAV (using a 10% discount rate), and a price per ounce of recoverable gold of $63. When Troilus goes into commercial production in 2029, we expect it will generate annual net income roughly equal to its current market cap. Troilus historically traded at an extremely low valuation because the market did not believe that the company could finance the project's upfront capital expenditure of $1.3 billion. Throughout 2025, Troilus began addressing these financing concerns by signing an offtake agreement with a European smelter and a related letter of intent for $700 million of debt financing on attractive terms. If Troilus Gold raises the necessary equity and signs a streaming arrangement to fully fund the mine’s construction, we believe the stock will trade much closer to its NAV (using a 10% discount rate and the spot gold price) of $2.5 billion. New Board Seat at Gran Tierra Energy On September 30, portfolio company Gran Tierra Energy announced that Brad Virbitsky has joined the board on behalf of Equinox Partners. While it is a relatively modest-sized position in the fund, we believe there is significant value to unlock, and we can help realize that value through our participation in the boardroom.
By Kieran Brennan October 30, 2025
Kuroto Fund Wins HFM 2025 US Performance Award
By Kieran Brennan October 30, 2025
Dear Partners and Friends, PERFORMANCE Kuroto Fund, L.P. appreciated +16.6% in the third quarter and is up +51.6% year-to-date 2025. By comparison, the broad MSCI Emerging Markets Index rose +11.0% in the third quarter and is up +28.2% for the year-to-date. Performance in the quarter was driven primarily by our investments in Nigeria, with additional strong contribution from our largest position, MTN Ghana. A breakdown of Kuroto Fund exposures can be found here . Portfolio Changes During the third quarter, we initiated a position in Solidcore Resources, a company described in our February webinar . Solidcore is similar to the oil companies we profiled in our Q2 2025 letter in that it is a competitively advantaged commodity producer. The company’s main asset is a long-lived and low-cost mine, the management team is among the best in the region, and the infrastructure they are building will make them a natural consolidator of regional assets. Given the subsequent increase in commodity prices, we ended up purchasing the bulk of our position at a 40%+ free cash flow yield. Solidcore is now a top 5 position in the fund. We funded our purchase of Solidcore by reducing our Georgia Capital position weighting from 17% to 11% and by selling our stake in a Greek consumer-focused business. In the case of Georgia Capital, while the discount to the sum of the parts value decreased from 50% to a more reasonable 30%, we still see it as a compelling investment opportunity. Georgia Capital’s portfolio of oligopolistic businesses is growing earnings double digits, buying back stock, and trading at a single digit, look-through price-to-earnings multiple. The sale of our Greek investment was driven by stock appreciation combined with a management change that led us to re-underwrite our investment. GHANAIAN AND NIGERIAN MACRO Over the past decade, Nigeria and Ghana have endured a seemingly unending series of self-inflicted macro problems. Inflation increased to over 30% in both countries, and the currencies depreciated 64% and 79%, respectively. Ghana defaulted on its domestic and foreign debt in 2023, and Nigeria imposed onerous capital controls for multiple years. However, 2025 has been a turning point for both countries. For the first time in over a decade, investors in these markets are experiencing macroeconomic tailwinds. In Ghana, since the beginning of the year, the currency has appreciated 43% vs. the U.S. dollar, GDP growth averaged over 6%, the budget has been in primary surplus, inflation declined from 24% to 9%, and debt to GDP declined from 62% to 43%. Ghana’s macro environment has improved due to three factors: One, Ghana’s debt restructuring is mostly finished, and the country now has a much smaller interest expense burden, which should decline further as the central bank lowers rates to be more in line with the decline in inflation. Two, the new government which assumed power in January has cut spending 14% in real terms. Three, the country has been helped by the large increase in the gold price, which is both the country’s largest export and a significant component of Ghanaian central bank reserves. Ghana now has 4.8 months of import cover, half of which is held in gold bullion. Whether Ghana can maintain this strong start to the year is an open question, but the fundamentals are certainly in a better place than they have been in the past decade. In Nigeria, President Tinubu’s bold reforms upon taking office are finally starting to have some effect. In 2023, Tinubu eliminated the local fuel subsidy which consumed about 40% of the government’s annual revenues, floated the currency which resulted in a 68% depreciation, forced a recapitalization of the banking sector, and removed the board of the notoriously corrupt national oil company and replaced them with technocrats who formerly worked at companies like Exxon and Shell. While not perfect, the scale of the reforms is impressive by any standard. A year later, inflation has fallen from over 30% to the high teens and is expected to fall to single digits next year. Economic growth has increased from less than 3% to over 4%. Oil production is up more than 10% and oil theft is down 90%. Importantly, the exchange rate has been stable for a year and anecdotally, we are hearing that conditions on the ground are night and day different, businesses are looking to invest, and banks are willing to lend. We initially invested in Ghana and Nigeria in 2018 with the expectation that both countries would eventually adopt a sane set of macroeconomic policies. While it took longer than we expected, sane policy is gaining traction in both countries, and our superior companies are getting re-rated to more sensible, albeit still very cheap, valuations. In Ghana, our main investment has been in MTN Ghana, which has compounded at approximately 25% in U.S. dollar terms since 2018 despite all the on-the-ground challenges. The stock’s historical return understates our investment performance because we increased our weighting at opportune times. The total contribution to our P&L has been +$17.7 million over that time frame, resulting in a +24.9% cumulative contribution to fund returns. Our Nigerian investment results have also been strong. While our initial entry was poorly timed, we added counter-cyclically, and as a result have generated +$9 million of P&L, contributing a cumulative +15.0% to the fund’s return. Our experience in both markets underscores the importance of our investment strategy of looking at out-of-favor markets to find competitively advantaged, well-run businesses at unusually cheap valuations. NEW BOARD SEAT AT GRAN TIERRA ENERGY On September 30th, portfolio company Gran Tierra Energy announced that Brad Virbitsky has joined its board on our behalf. While it’s a relatively modest position size in the fund, we believe there is significant value to unlock and we can contribute to that process through our participation in the boardroom. Sincerely, Sean Fieler & Brad Virbitsky
By Kieran Brennan August 1, 2025
Dear Partners and Friends, PERFORMANCE Equinox Partners Precious Metals Fund, L.P. rose +13.2% in the second quarter of 2025 and is up +39.7% for the first half of 2025. By comparison, the Junior Gold Mining Index GDXJ rose +18.7% in the quarter and is up +58.7% for the first half of the year. Our meaningful year-to-date underperformance relative to the GDXJ reflects the continued discount at which our companies trade compared to peers. Specifically, our portfolio of producing companies trades at an average internal rate of return (IRR) of 24%, roughly double the 11.5% IRR of the broad universe of gold miners that BMO covers. the gold mining bull market is young The skepticism that characterizes the gold mining sector stands in sharp contrast to the enthusiasm in the broader stock market. The animal spirits that have propelled popular stocks like Wingstop and Robinhood to an average of nearly 80 times 2025 earnings remain totally absent among gold mining investors. One indication of the sober mood that dominates the gold mining sector is the use of gold price assumptions below spot in net asset value (NAV) calculations. Looking at four important sell-side houses for the sector, their models include an average long-term price assumption of $2,400 per ounce, representing a 28% discount to the quarter-end spot price. 
More Posts